Merkle released its Digital Marketing Report for the first quarter of 2021. After an unusual holiday season, in 2021, consumers showed continued interest in e-commerce. Travel continued to show improvements and much more. We have penned down some of the key findings from the report in this post.
You can download the report here.
Google Paid Search – Strong Click & Ad Spend Growth in Retail, Travel & Device Types
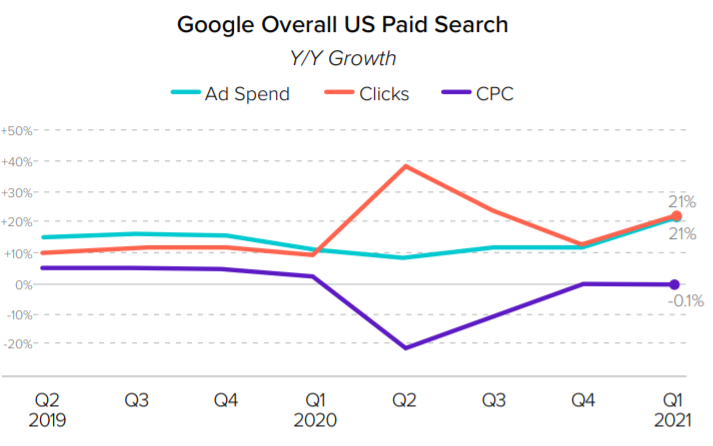
Overall search ad spend and click growth both accelerated in Q1 2021. Spend increased 20% Y/Y, reaching its highest growth level of any quarter. Clicks grew 21% Y/Y while CPC declined 12% Y/Y.
Google paid search clicks grew 21% and CPC remained virtually flat Y/Y. Flat CPC growth and strong click growth combined to generate 21% ad spend growth, the highest Y/Y growth figure of any quarter over the past two years.
Retail Industry – Click Growth Strengthened In Q1
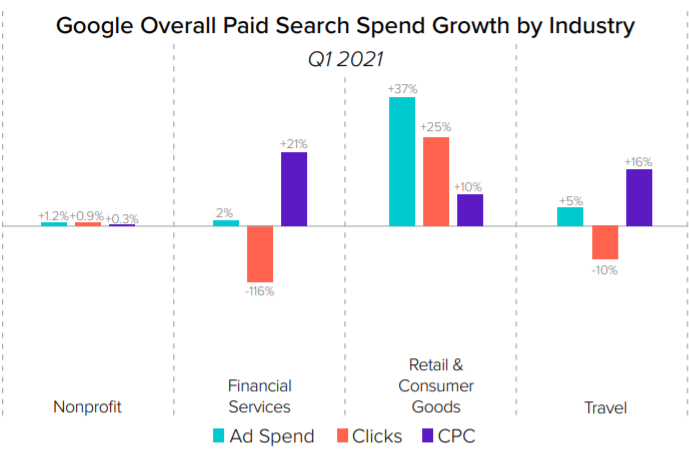
In the retail industry, Google paid search spend growth & click growth soared back to 33% and 30% Y/Y respectively in the month of January. Retail and consumer goods continued to experience Y/Y growth across all three metrics from increased e-commerce demand. Other key sectors, including travel and financial services, also contributed positive Y/Y spend growth.
After dipping to 54% in Q4, Google Shopping’s share of retail clicks rebounded to its prior level of 60% in Q1.
Travel Industry – Slower But Consistence Improvement
Google search spending by travel advertisers increased by 5% Y/Y while click declines Y/Y improved from 14% in Q4 2020 to 10% in Q1. Financial services posted 2% Y/Y spend growth, with a higher CPC offsetting a decline in clicks.
Device Types – Phone & Desktop Climbed Up While Tablet Saw The Decline
While clicks on phones increased 27% year over year, desktop clicks also grew 13% Y/Y after experiencing 14% growth in Q4. Tablet continued to see Y/Y click declines, coming in at 13% for Q1. Phones experienced 3% lower CPC Y/Y, while desktop CPC climbed by 7% Y/Y.
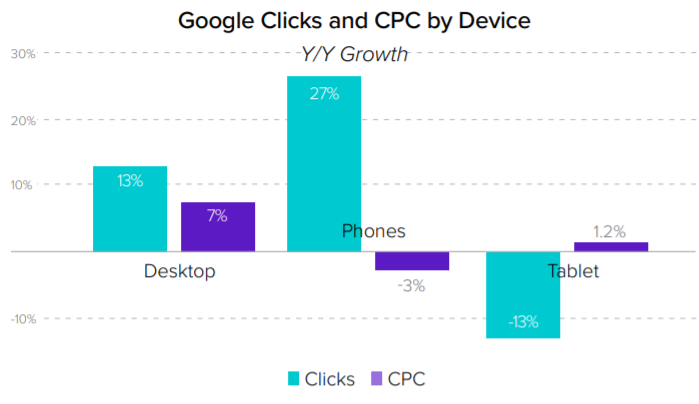
Spending on Google desktop searches was up 22% Y/Y. Spend growth on phones has reached 23% Y/Y. Increases on the desktop were driven by a mix of higher clicks and CPC, while mobile phone growth was driven entirely by Y/Y click improvements.
Phones and tablets produced 49% of paid search ad spend in Q1. Phone spend share increased by 1.5 points over Q4, while tablet decreased by 0.8 points. And tablet continues to steadily decline.
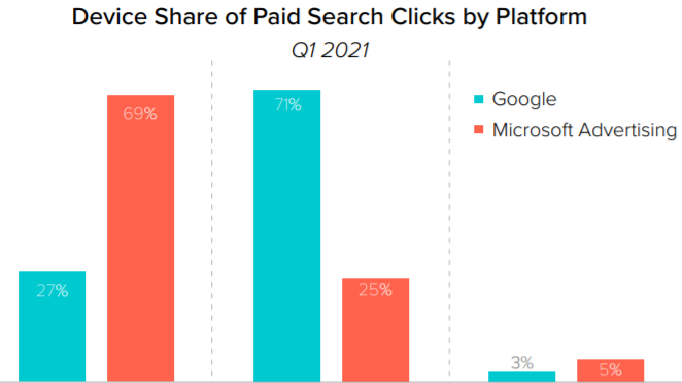
If we talk about device share of paid search clicks by platforms, Phones generated 71% of Google search clicks, desktop contributed 27% of clicks. Microsoft showed a nearly opposite trend, with desktop accounting for 69% of clicks and phones generating 25% of clicks.
Google Organic Search – Strong To Moderate Growth Overall
Total year-over-year organic search visit growth decreased to 18% which is below the Q2 2020 peak of 33%, Paid search click growth accelerated in Q1, which may have contributed toward decelerated organic visit growth rates.
Retail Industry – Growth Slowed Down But Still Strong
Overall growth for essential retailers slowed by 33% in Q1. Grocery growth remained high at 57% while big-box retailers saw slower growth of 23% Y/Y. Apparel and non-essential goods saw accelerated growth in Q1 of 4% and 40% respectively.
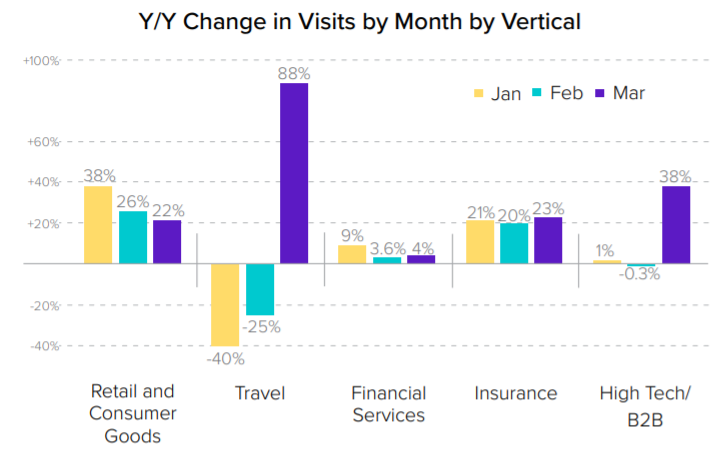
Retail and consumer goods Y/Y growth decreased steadily month to month, with January seeing the strongest Y/Y growth of the quarter at 38%.
Travel And High Tech/ B2B Industry – Experienced Large Growth In March 2021
Travel and B2B industries were highly impacted in March 2020 by the start of the COVID-19 pandemic but March 2021 bought significant growth to these industries.
Insurance growth was stable. Financial services saw single-digit Y/Y growth during each month of Q1.
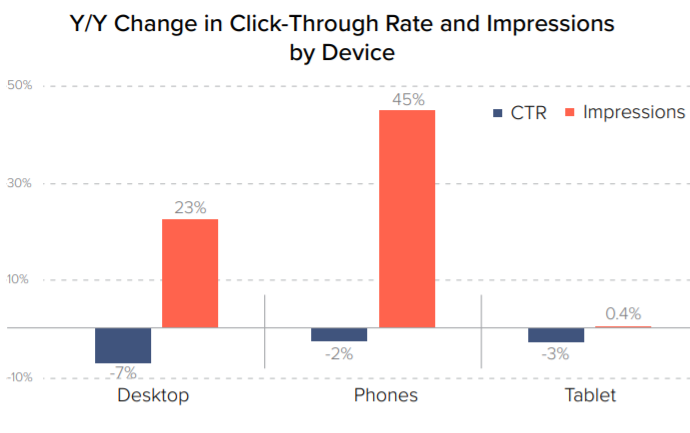
Device Types – Click-Through Rate Declines While Impression Grew Significantly
Though CTR (Click Through Rate) declined across all devices, phones fared the best. It showed 45% Y/Y impression growth with just a 2.4% decrease in CTR. Desktop saw lower impression growth of 23%. Impression on the tablet was nearly flat with CTR down 2.8%.
With regards to Google organic search visits to brand sites, phone and tablet combined to generate 59% of organic search visits in Q1 2021.
Amazon Ads – Sponsored Brand Overpowered Sponsored Products
Where spending growth for Amazon Sponsored Product ads was nearly flat Y/Y, Amazon Sponsored Brands ads experienced 29% sales growth Y/Y.
Clicks continue to grow at a modest rate of 11% for sponsored product ads however, click growth remained similar quarter to quarter, coming in at 38% Y/Y for Q1 for sponsored brand ads.
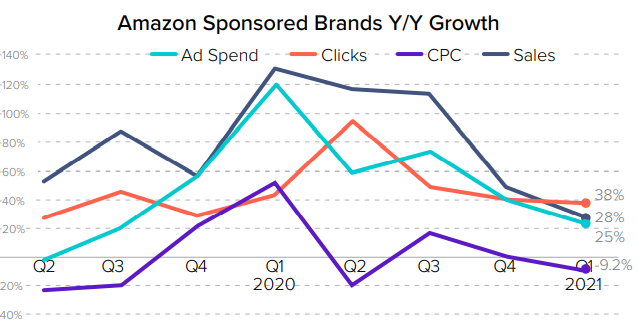
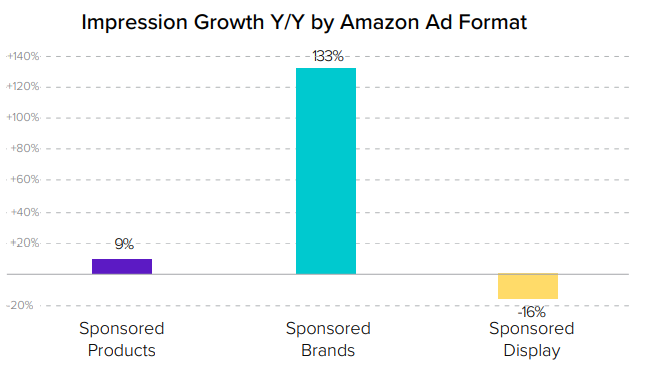
Impression growth for sponsored brands far exceeded that of sponsored products. As brands captured significantly more impressions Y/Y, CTR on Sponsored Brands fell, leading to click growth of 38% Y/Y.
Spend share for Amazon sponsored brands accounted for 23%, marking a four-point increase over Q4 whereas sponsored products experienced significantly lower spend growth. Sponsored Display also gained spend share, finishing Q1 at 4%.
Display & Paid Social – Digital Channels & Social Media Platforms Indicated Continuous Growth
Spending on Facebook ads, excluding Instagram, grew 20.7% Y/Y. Facebook impression growth remained steady at 2.1% Y/Y. CPM saw higher Y/Y increases in Q1 2021.
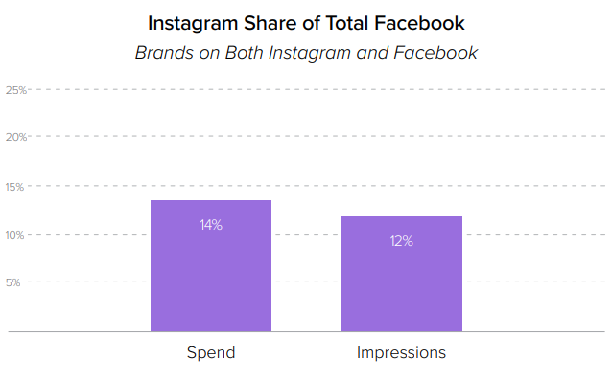
Instagram Ad spending increased 57.5% Y/Y, up from 29.6% in Q4 2020. Instagram accounted for 14% of total Facebook ad spend and 12% of impressions, among brands running on both platforms.
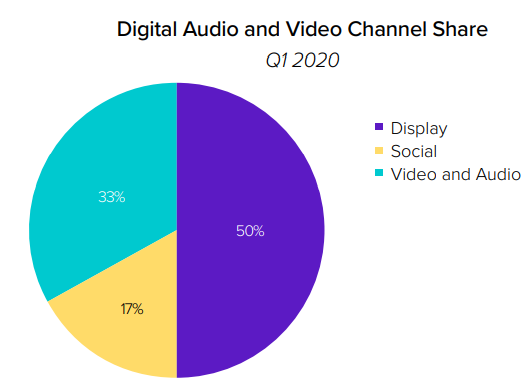
New channels like video and audio enclose a significant share of digital media. Accelerated by the pandemic, growth in streaming offerings like Disney+ and Discovery+ are attracting advertisers with measurable media.
Smaller social platforms, like Pinterest, Snapchat, and LinkedIn received lower budgets in Q1 2021. Pinterest received the most comparable budget from quarter to quarter (13.9% in Q4 to 8.4% in Q1), with Snapchat decreasing significantly (from 12.1% to 0.4%).
Once again, here is the link to download the report and access the findings.
Related Links




Stop the wasted ad spend. Get more conversions from the same ad budget.
Our customers save over $16 Million per year on Google and Amazon Ads.