Boost your digital advertising approach with Tinuiti’s Q1 report. This data-driven analysis of Google, Meta, Amazon, and other platforms, using anonymized campaign information, provides valuable insights to help you make well-informed decisions.
The complete report can be downloaded here.
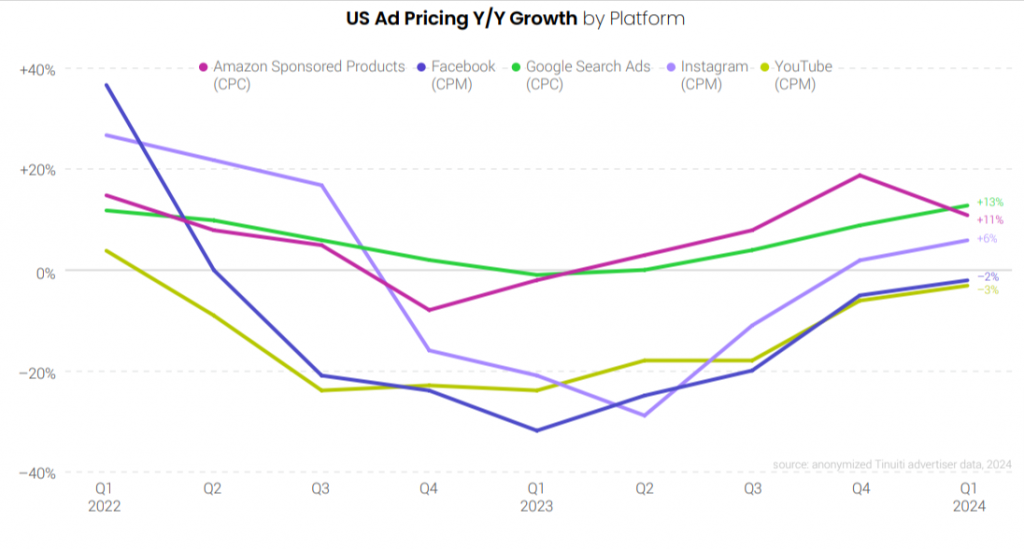
Google Search Ads: Steady Growth Despite Competitive Landscape
The rise of automated ad formats like Performance Max and the entry of major competitors like Temu are stirring things up in the Google search ad world.
The rise of Performance Max campaigns and the arrival of Temu added new layers of complexity to the Google search ad world. Nevertheless, spending growth remained robust, with a 17% year-over-year increase from Q4 to Q1.
Google search ads focus on CPC rather than impressions (unlike some platforms) and target users closer to purchase. This approach might be why their prices didn’t drop as much as others in late 2022 and early 2023.
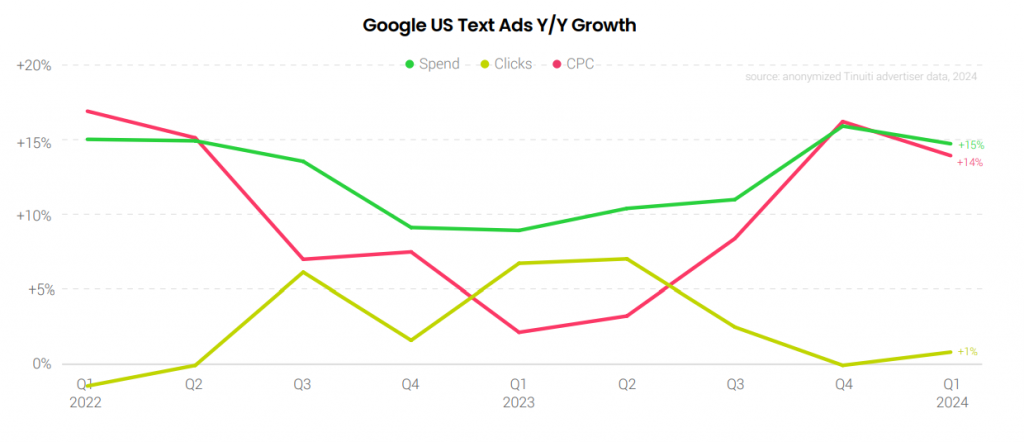
Google Text Ad Spending Growth Fueled by Rising CPCs
It is interesting to know that over the past 20 quarters, text ad CPCs have shown a faster growth rate than shopping ad CPCs, with only one quarter seeing a reversal.
Q1 2024 saw a 15% YoY increase in spending on Google text search ads. Click growth slowed to 1%, while CPC growth experienced a slight moderation, from 16% YoY in Q4 to 14% YoY in Q1.
The average CPC for a typical retail brand running Google search ads has increased by 40-50% compared to five years ago. Over the last year alone, from the first quarter of 2023 to the first quarter of 2024, Google retail search ad CPCs grew by around 20% for the median advertiser.
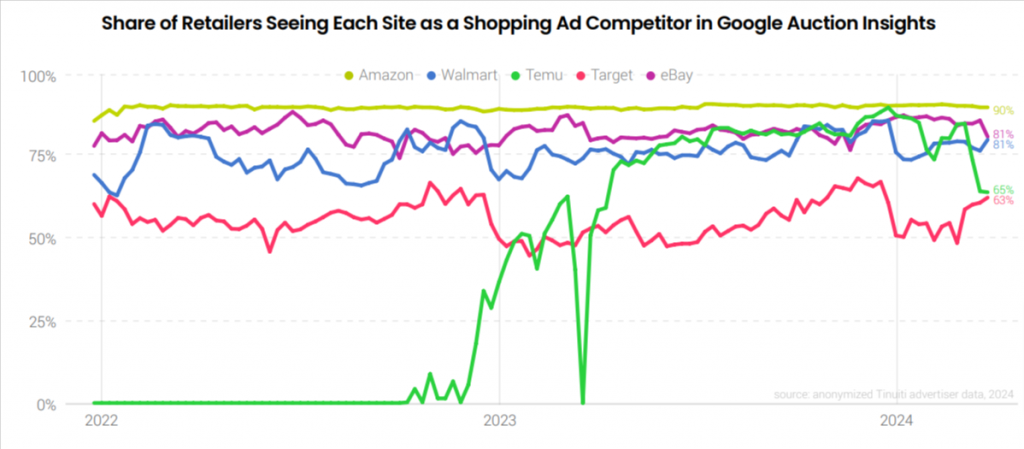
Temu’s Role in Google Shopping Ad Auctions Declines in Q1 2024
Advertisers’ spending on Google shopping ads, which includes both Performance Max and Standard campaigns, grew by 21% in the first quarter compared to last year. This growth happened even though click growth slowed from 13% in the fourth quarter to 6% in the first quarter. In the first quarter of 2023, the cost-per-click for shopping ads had decreased by 3% year-over-year, but by the first quarter of 2024, it had increased by 13% year-over-year.
In Google’s Auction Insights report, 90% of retailers who run Google shopping ads identified Temu as one of their major competitors. However, Temu’s standing in Google’s auctions appeared to weaken in the first quarter of 2024, especially during the final three weeks of the quarter.
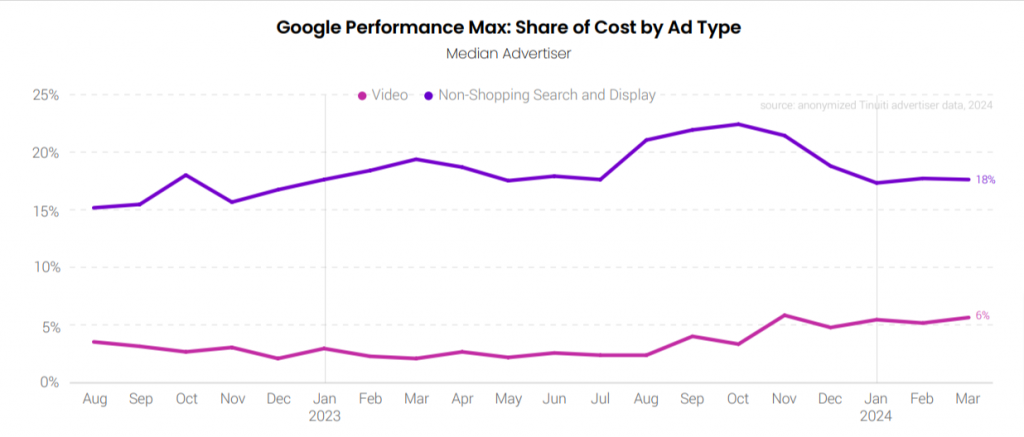
Google PMax: Adoption Rate & Non-Shopping Contribution Drop in Q1 2024
During the holiday shopping season in the fourth quarter of 2023, 91% of retailers placing shopping ads on Google used Performance Max campaigns. However, this percentage slightly declined in the first quarter of 2024.
In the first quarter of 2024, video and other non-shopping ad inventory made up 23% of Performance Max spending, a decrease from 26% in the fourth quarter of 2023. The cost share for video ads remained stable between Q4 and Q1, while the cost share for non-shopping search and display ads dropped by three percentage points.
Strong Growth in Google Demand Gen Spending Among Active Brands
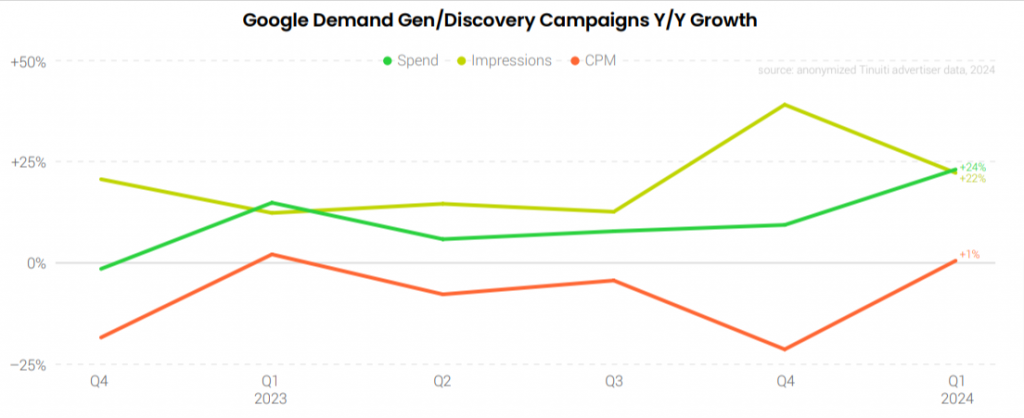
In Q4 2023, Google began the process of transitioning its Discovery campaigns to Demand Gen campaigns. The new model opened up additional inventory, including from YouTube Shorts, as well as other new ad options.
For brands that remained active on Discovery/Demand Gen campaigns in both Q1 2023 and Q1 2024, spending was up 24% Y/Y in Q1. Impression growth cooled from the big jump of 40% Y/Y, impressions were up 22% Y/Y in Q1 while average CPM was 1% higher.
Advertiser spending on the Google Display Network (GDN) was up 10% Y/Y in Q1 2024 as apps and video drive half of spending. GDN impressions were down 1% Y/Y and Average GDN CPM was up 12% Y/Y in Q1 2024.
Click here to get the complete Digital Ads Benchmark Report.
Related Links




Stop the wasted ad spend. Get more conversions from the same ad budget.
Our customers save over $16 Million per year on Google and Amazon Ads.