When a user searching for something sees a relevant ad, clicks on it, and visits the advertiser’s landing page, Google wants that entire experience to be good. Quality Score for keywords is a Google’s way of ensuring that advertisers create most relevant ads and landing pages for the search terms. Google awards, by means of a lower Cost Per Click, those who take great effort of ensuring right ads are shown for right keywords and the landing page is relevant to the keyword.

Quality Score has 3 components – Expected Clickthrough Rate, Ad Relevance and Landing Page Experience. Each of these components is given a score of Below Average, Average and Above Average. Final Quality Score is a weighted combination of these 3 attributes and it results in a number between 1 to 10. A score of 6 is considered average.
Typical workflow to identify QS problems involves filtering keywords by “low” QS and going through them. Hovering the mouse on the keyword status provides the details of the 3 attributes. Here’s a screen that shows quality score for a keyword along with how that keyword performs for each of the attribute.
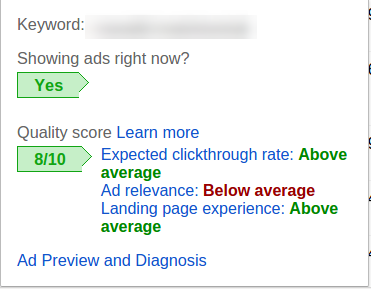
If you want to find out all the keywords where Ad Relevance is rated as “Below Average”, it is rather tedious to go through all the keywords’ status.
Last month (February, 2016), Google released an update on Quality Score in their APIs. Now, in addition to the Quality Score number, Google provides the break down of individual components for a keyword. This update makes working with quality very easy.
But, this data is available only with APIs and AdWords scripts. It is not yet available through the AdWords Web UI or AdWords Editor. Hence, we are publishing an AdWords script that will provide you break up of the Quality Score attributes for each keyword. Let’s understand what insights the script will provide you.
Here’s a report that is very similar to keyword performance report that you can download from AdWords Web UI. There is one addition to it. For each keyword, you can see the 3 components of Quality Score for that keyword. To help you visually understand the data, the Below Average score is highlighted with red background and Above Average score has green background. Average score has a neutral grey background. For example, in the result below, you can see Ad Relevance for many many keywords is Below Average. Time to write some new ad copies.
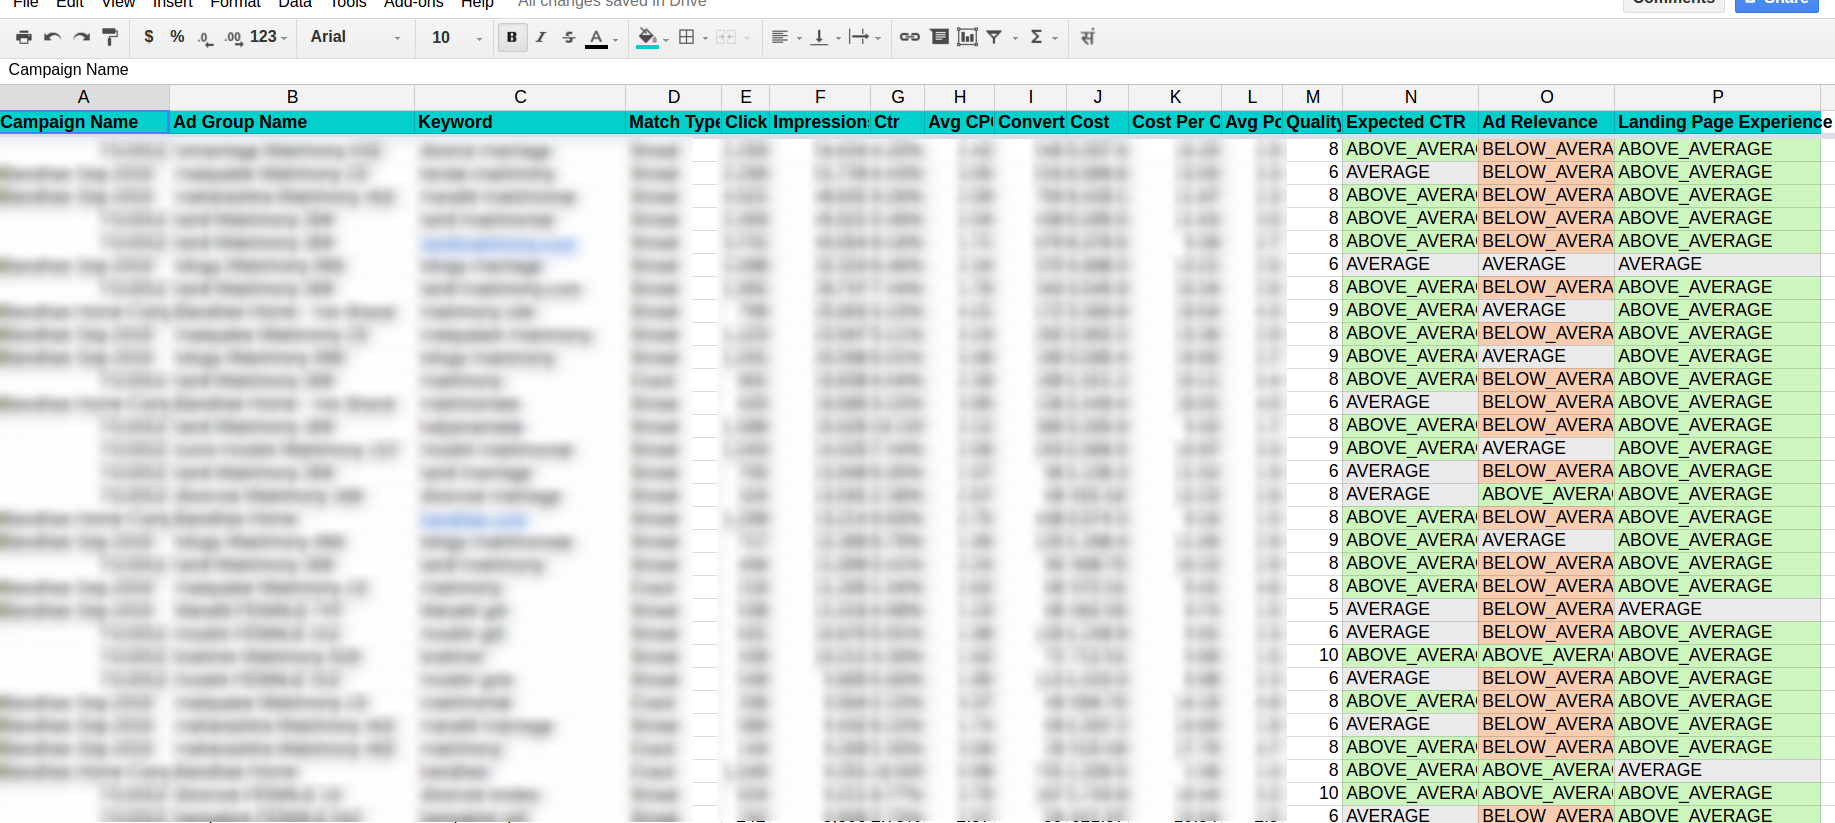
Since this data is available in Excel, you can sort and filter it in any way you want. This wealth of raw data is waiting for you to mould it to your liking.
Beautiful Quality Score Charts Pre-Cooked for You
If you want a bird’s eye view of your account or campaign, this AdWords script creates a summary sheet for your data. It also creates some great looking charts that you can take a look at and understand exactly what is happening.
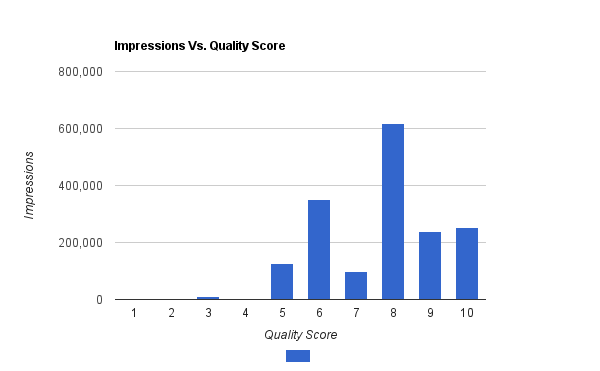
For example, this chart will show you total number of impressions happening at each quality score. That is, for each quality score from 1 to 10, impressions for all the keywords at a particular QS are clubbed together and that becomes the cumulative impression for that score. Here, you can see that QS of 8 has the highest impressions with score of 6 being the next highest one.
You can create similar chart for Quality Score vs Clicks/Spend/CPC, etc.
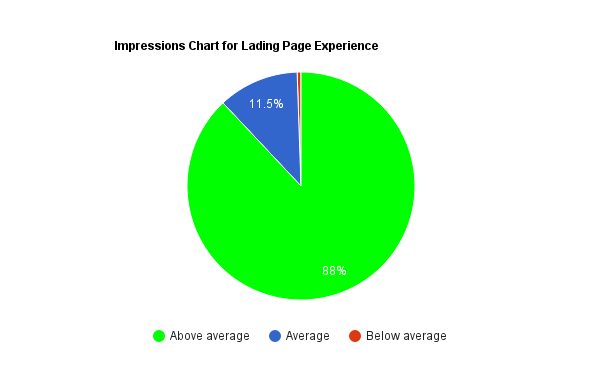
Now, some charts using the newly available data. Let’s find out performance of landing page across the account.
This pie chart will show that 88% of the impressions for the keywords have Landing page experience of Above Average. High Five!
Similarly, this chart will show you impressions by expected CTR and Ad Relevance.
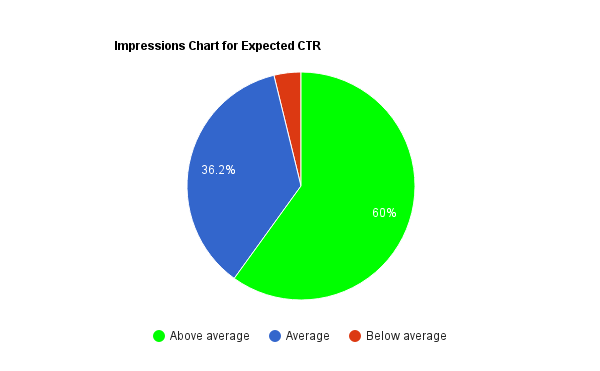
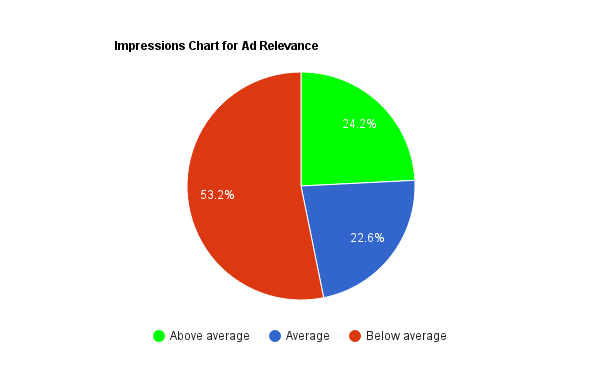
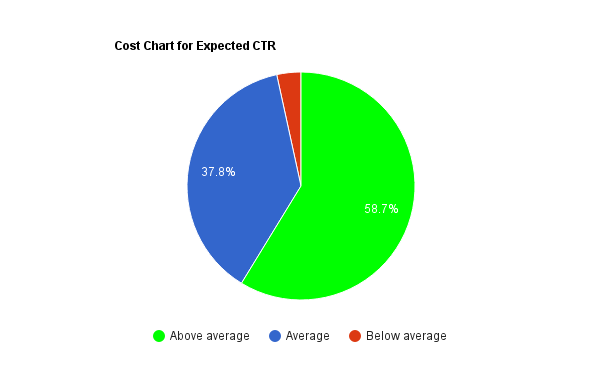
If you wish, you can draw similar chart for Cost vs any of quality score attribute. The summarized data is right there.
The Quality Score Script
Now that you know all the data that you can get from this script, let’s talk about the script.
Here are the variables that you can change to customize it to your requirement.
- REPORTS_FOLDER_PATH : This is the name of the folder that gets created in your Google drive. By default the name is ‘Quality Score Analysis’. If you wish to change the name you can do so here.
- DATE_RANGE: You can use some pre-defined ranges like LAST_30_DAYS or LAST_14_DAYS. By default, the script will get the data for last 30 days.
- USE_CUSTOM_DATE_RANGE : If you want a particular date range to be used then, set this flag to “true” and modify the START_DATE and END_DATE to indicate the date range. The date format is “yyyy-mm-dd” aka “Year-Month-Date.” For example, if you want a report from last quarter of 2015, the START_DATE would be “2015-09-01” and END_DATE would be “2015-12-31.”
- IS_MCC_ACCOUNT : This flag is to indicate whether you will be running this script at MCC-level. By default, it is set to false. Change it to “true” if you want to use for all the linked accounts in your MCC account. The results for each account will be stored in a separate sheet. Be careful, if you have many many accounts.
- IGNORE_PAUSED_CAMPAIGNS and IGNORE_PAUSED_ADGROUPS : These flags indicate to ignore paused campaigns and ad groups. By default, these are set to true. All paused keywords are ignored by default.
- MAX_KEYWORDS : You will get report for top 1,000 keywords (ordered by impressions in the decreasing order) in the account. You can get results for more keywords by changing the value here.
- FILTER_ACCOUNTS_BY_LABEL : If your MCC account has tons of linked accounts, you may not want to run this script for all the accounts. In that case, turn this flag to “true” and then specify the label with ACCOUNT_LABEL_TO_SELECT variable. Only the accounts with the specified label will be analyzed to generate this report.
Once again, here is the link to the AdWords script.
Feel free to send us an email (support AT karooya.com) if you have any queries for this script.
Get all the AdWords scripts published by Karooya
Related Links:
- Why quality score is an essential component of PPC audit
- Track expanded text ads performance with Adwords script
- Important Adwords scripts released in 2016
- API/Script development services


Stanislav
Hi,
many thanks for one of the most useful Adwords script on internet!
Unfurtonately I have an issue with it – the script loads and analyzes only a part of the bunch of the keywords (approximately 50 %). I have been playing with the date range and it really affected the number of analyzed keywords. But then I stopped in the half of my keywords set.
Do you have any idea what could cause the problem?
Thanks and have a great Monday!
Stanislav
Shashikant
Hi Stanislav,
There are couple of possibilities.
The script fetches quality score for only top 1000 keywords, by impression. If you are running in to this limit, please update MAX_KEYWORDS variable to, say, 5000 and see if it fetches data for all the keywords.
Second possibility is that the keywords getting dropped as they don’t have quality score data. Google updated quality score reporting recently due to which keywords that do not have quality score are excluded from reports.
https://support.google.com/adwords/answer/2454010?hl=en
It is possible that the keywords that are missing do not have a quality score. Most likely, these keywords do not have enough impressions. You can check some of the missing keywords to see if they have meaningful number of impressions.
Please try out these things and please let us know if it solves your problem.
BTW, if you have modified the script, please share it with us (support at karooya.com). We will take a look at it to see if the changes have resulted in this behavior.
Thank you for trying out the script.
–shashi
Co-founder, Karooya
Stanislav
Hi Shashi,
many thanks for answering. Unfortunately it has not helped – there are still a minority of keywords that are missing. It is just a small account with approximately 250 keywords. I have tried all these thinks but without any improvement:
– increase the limit of MAX_KEYWORDS
– set custom date range
– turn off the impression limit
But this easier script is working for me properly – but your fomatting and fancy charts are missing:
var SPREADSHEET_URL = ‘URL-OF-YOUR-GOOGLE-SHEET’;
function main(){
var spreadsheet = SpreadsheetApp.openByUrl(SPREADSHEET_URL);
var report = AdWordsApp.report(“SELECT CampaignName, AdGroupName, Criteria, KeywordMatchType, Cost, Impressions, Ctr, Clicks, ConvertedClicks, QualityScore, SearchPredictedCtr, CreativeQualityScore, PostClickQualityScore FROM KEYWORDS_PERFORMANCE_REPORT WHERE Id NOT_IN [3000000, 3000006] AND Status = ‘ENABLED’ AND AdGroupStatus = ‘ENABLED’ AND CampaignStatus = ‘ENABLED'”);
report.exportToSheet(spreadsheet.getActiveSheet());
Logger.log(“Report available at ” + spreadsheet.getUrl());
}
Anyway thanks again for your help!
st.
ioannis
Really nice and helpful script!
Just take note that for the spreadsheet URL the one you have on the scripts returns an error.
var SPREADSHEET_URL = ‘https://docs.google.com/YOUR-SPREADSHEET-URL-HERE’
I had to paste the whole sharing URL from google docs for the script to run.
https://docs.google.com/spreadsheets/d/YOUR-SPREADSHEET-URL-HERE/edit?usp=sharing
Keep on the good work!
Shashikant
Ioannis,
Glad you liked the script.
We have mentioned about the variable SPREADSHEET_URL in the final notes (you have to scroll down a bit). But, I guess, it is not obvious enough and one may miss it. We will fix it.
Thanks for stopping by.
Jochen
Thanks a lot for the script. I was just wondering if I could also be used to track quality score development over time? It seem to me that it is a great script to produce reports for in depth status quo examination but might not be ideal to track progress over time. Any thoughts on this would be greatly appreciated. Regards, Jochen
Shashikant
The following script will help you track quality score over a period.
http://www.ppc-epiphany.com/2016/03/11/introducing-the-quality-score-tracker-v3-0/
Tina
Extremely helpful. Thank you for sharing!
I noticed the date range has the below options. I’m wondering if there’s any way to get the 90 days of performance?
Other allowed values are: TODAY, YESTERDAY, LAST_7_DAYS, THIS_WEEK_SUN_TODAY, THIS_WEEK_MON_TODAY, LAST_WEEK, LAST_14_DAYS, LAST_30_DAYS, LAST_WEEK, LAST_BUSINESS_WEEK, LAST_WEEK_SUN_SAT, THIS_MONTH, LAST_MONTH
Sachin Doshi
Tina,
We are glad you liked the script.
Unfortunately AWQL does not support any DateRangeLiteral that is equivalent to Last-90-days (Ref).
But, you can use custom-date-range option in our script. Using custom date range option you can choose any arbitrary dates. To do so please do the following –
1) Set the flag USE_CUSTOM_DATE_RANGE
2) Set the values for START_DATE and END_DATE
3) Leave the value DATE_RANGE variable unchanged or set it to empty string.
Example
var DATE_RANGE = "";var USE_CUSTOM_DATE_RANGE = true;
var START_DATE = "2016-01-01";
var END_DATE = "2016-03-31";
-Sachin
Co-founder, Karooya
A. Gopinath
Hi,
Thank you for the script
i works well for each account level, but at mcc level if i want to filter by label or filter by id’s how should i declare it.
Example:
in the script it has
var FILTER_ACCOUNTS_BY_LABEL = false;
var ACCOUNT_LABEL_TO_SELECT = “INSERT_LABEL_NAME_HERE”;
then i changed to
var FILTER_ACCOUNTS_BY_LABEL = true;
var ACCOUNT_LABEL_TO_SELECT = “vmfr – 2016, vmfr – 2015”;
then i ran the script i shows error.
please guide me how to put the more than one labels & more than one id’s in the script.
Regards
Gopinath. A
Sachin Doshi
Hello Gopinath,
Thank you for trying out the script.
@Filter accounts by multiple labels:
Currently the script accepts only one label as a filter. We can not put more than one labels in the variable ACCOUNT_LABEL_TO_SELECT. We will see how we can add support for multiple labels as input for account filter.
Mean while, we suggest you to create a new label, say ‘karooya-qs-script’ in your AdWords account. Then add the new label to all the accounts you wish the script to analyse. Please let us know if that solves your problem.
——–
@Filter accounts by multiple account Ids:
The script does accept multiple account Ids filter. You can do so by setting the two variables as below –
var FILTER_ACCOUNTS_BY_IDS = true;var ACCOUNT_IDS_TO_SELECT = ['1234567890', '1234567891'];
NOTE: When you are using filter by account IDs, you may want to set FILTER_ACCOUNTS_BY_LABEL to ‘false’.
-Sachin
Co-founder, Karooya
Ian Turnbull
Hello,
What a great script, thanks so much for sharing this. I would however like to add another collum called “Keyword Id.” I have added this in as an element on lines 160, 209 & 222 as stated below. I am getting an error message when doing so stating, “Column ‘KeywordID’ is not valid for report type KEYWORDS_PERFORMANCE_REPORT. Double-check your SELECT clause. (line 165)”. Are there any other inputs that should be made? I plan to run this report weekly and then to join the data for a final report and need to be specific as possible.
Thanks so much
line 160
var query = “SELECT CampaignId, AdGroupId, Id, CampaignName, AdGroupName, Criteria, KeywordMatchType, KeywordID
line 209
[ kw[“CampaignName”], kw[“AdGroupName”], kw[“Criteria”], kw[“KeywordMatchType”], kw[“KeywordId”],
line 222
var headers = [“Campaign Name”, “Ad Group Name”, “Keyword”, “Match Type”, “Keyword ID”, “Clicks”, “Impressions”, “Ctr”, “Avg CPC”, “Conversions”, “Cost”, “Cost Per Conversion”, “Avg Position”, “Quality Score”, “Expected CTR”, “Ad Relevance”, “Landing Page Experience”];
Sachin Doshi
Hello Ian,
Thank you for the kind words. We are glad that you found the script useful.
To add the ‘Keywords Id’ column to the report – you were almost right about the changes. Except that the column name is ‘Id’; and not ‘KeywordID’ (Ref).
So, you will need to make only the following changes –
Line 160:
Unchanged. The AWQL query at line#160 is already fetching the ‘Id’ column.
line 214
kw[“PostClickQualityScore”].replace(/\s/g, “_”).toUpperCase(), kw[“Id”]
line 222
var headers = [“Campaign Name”, “Ad Group Name”, “Keyword”, “Match Type”, “Clicks”, “Impressions”, “Ctr”, “Avg CPC”, “Conversions”, “Cost”, “Cost Per Conversion”, “Avg Position”, “Quality Score”, “Expected CTR”, “Ad Relevance”, “Landing Page Experience”, “Keyword ID”];
Note: The above changes will add the ‘Keyword ID’ column at the end. But, if you wish to add the column earlier, make sure that you update line#225 to line#236 to get the data formatting and color coding right.
We hope this solves your problem. Feel free to send us an email to support[at]karooya.com if you have any other query.
Ian Turnbull
Thanks so much for the insight. I am just running into one final problem. When running the script I get an error message stating “Incorrect range width, was 18 but should be 17 (line 225)”
In what way should I edit the sheet to accommodate the new column?
Thanks again for the help.
-Ian
Sachin Doshi
There could be some error/typo in your script. Please check the code between line#209 to line#214. The number of value elements you insert there must match the number of column-headers you have at line#222.
Balamurugan
Hi,
Really an amazing script.
When I ran the script and I found that the cost value in the Quality Score Table is not matching with the keyword report.
Eg. The Cost Values in all the tables in the Summary Sheet is not matching with the total cost in the Components Breakdown Sheet. Please check and let me know for any updates.
Sachin Doshi
Hello Balamurugan,
Thank you for bringing it to our notice. Yes, there was an error with the code that parsed the value of the ‘Cost’ field.
We have updated the script to fixed the issue. Please re-download the script from the same location mentioned above.
Balamurugan
Hi Sachin,
Wow!
Thanks for updating the Script and the values are now matching!
Great Work here!
Could you please update us with more scripting?
Happy Scripting,
Bala
Balamurugan
Hi
When I re-run the script the graphs in the old sheets are not replaced, instead, it shows two graphs for each.
I really need a help on this to update the script.
Thanks,
Balamurugan
Sachin Doshi
Hello Balamurugan,
We have updated the script with a few enhancements. The script now creates new spreadsheets per account in a Google Drive folder (useful for mcc accounts); and writes new report-sheet per execution date (enabling you to keep the old reports). This modified script also handles the issue you mentioned here. Please give it a try.
Balamurugan
Hi Sachin,
WoW!! Thank You for the notification.
I re-ran the newly updated script for active campaigns, ad groups, and keywords, but again the values in the report and UI are not matching.
While checking we saw few active ad groups are not included in the report.
Please check and do let me know regarding this update.
Thanks,
Bala
Sachin Doshi
Could you please elaborate on which numbers you found are mismatching? Are the values for individual keywords not matching?
If you are comparing aggregated values please note that the script omits keywords that do not have quality score. So, you may find discrepancy in the aggregated numbers, if such keywords have some impressions/clicks.
Also, note that, by default, the script includes only the top 1000 keywords by impressions. If you have more keywords this may lead to discrepancies in the aggregated numbers. If you want to include more keywords, you can do so by editing value of the variable ‘MAX_KEYWORDS’ in the script.
Sachin Doshi
Thank you for confirming that the discrepancy was because of the keywords-without-the-QS receiving some impressions. Please note that, we could modify script to include those keywords in the Details sheet. But, that will lead to discrepancy between aggregated numbers in Summary and Details sheet. So, we chose not to include those keywords.
Dipa Iyer
Hi,
I have been running this script in my accounts since Feb 17 and it rand perfectly the first couple of times. This script is now throwing an error
Invalid reporting query: UNSUPPORTED_VERSION: RequestError.UNSUPPORTED_VERSION. (line 165)
and the line in question is
return AdWordsApp.report(query, API_VERSION);
Please could you let me know of a way to correct this.
Thanks & Regards
Dipa
Sachin Doshi
Please use the latest script. You can download it at the same location as mentioned above.
We have updated the script with a few enhancements. And the new script works with the latest AdWords APIs.
Kate
Hi,
The script still returning the same error “UNSUPPORTED_VERSION: RequestError.UNSUPPORTED_VERSION”. Can you have a look and see where needs updating please?
Thanks,
Kate
Sachin Doshi
We have updated the script to use newer versions of the AdWords APIs. Please re-download the script.
Penelope Konrad
Did the script change? I am having trouble finding where to paste in the spreadsheet url I want the report generated in.
Sachin Doshi
Yes. There is no need to enter/edit spreadsheet url anymore. The script now creates new spreadsheets per account in a Google Drive folder. The updated script also writes new report in a new worksheet (new tab in the spreadsheet) for every new execution date, enabling you to keep and manage the old reports.
By default, the reports folder name is ‘Ads Performance Reports’ created in your ‘My Drive’ area. But, you can edit the ‘REPORTS_FOLDER_PATH’ variable to change name and/or path of the folder. Names of the spreadsheet will be in form of ‘Account-Name (AccountID)’
Penelope Konrad
Still having trouble getting the output for this script. It appears to have ran successfully but I am not getting a url to the reports, nor can I find a folder “Quality Score Analysis” or any folder which is supposed to get generated. Is it possible to go back to the format where I create and assign a spreadsheet for the report to get generated in?
Thanks so much!
Penelope
Sachin Doshi
Please visit following URL https://drive.google.com/drive/my-drive . Sign-in with the same credentials that you used to sign-in the AdWords account that uses the script. You will find the folder named “Quality Score Analysis”.
Alternatively, please re-download the latest script. It should print the direct URL for the aforementioned folder in Google Drive.
Penelope Konrad
Got it! Thank you so much, this script is so helpful!
Zita Kuttor-Mariasi
Hi,
I am relatively new to Adwords and it looks that would be really helpful! Could you please help me how can I set up this script? Where should I past it?
Thanks a lot,
Zita
Prashant Saini
Is there a way i can apply a campaign filter? If I just want to run it for selected campaigns?
Thanks.
Prashant
Sachin Doshi
If you are running the script for a single account (non-mcc), a quick hack can be to add the following code at #line157
whereStatements += “AND CampaignName IN [‘MyCampaignName1’, ‘MyCampaignName2’] “;
Please note that the script already provides ways to exclude paused campaigns, paused ad groups, etc.
tom
Hello, following on from this, is there a way to include a campaign name contains eg. show all campaigns that contain “brand”?
Kirti
Hi Tom, This option is currently not available. We will consider it for our future updates.
suhail
Hello, I have few keywords with lots of impressions and less clicks. My Competitor is just on 1st position always for that keyword. how should i reach on 1 st Position – QS is 7 on all of my keywords. Please suggest.
daniel
When running with account label filters, is it possible to aggregate the data? At the moment, it keeps telling me that the label does not exist even though I added the “karooya-qs-script” to a couple of campaigns.
Sachin Doshi
Hello Daniel, The current script doesn’t support filtering campaigns by label. It can only filter paused campaigns. Please also read my reply on “February 1st, 2018” for a quick hack.
King Rosales
Thanks for sharing this script! Im going to test it out and see if I come across any issues like some people have. But I hope it works and I look forward to testing it!
Tim
Hi,
Thanks for this script! Is it also possible filter within the ad account on campaigns?
I saw the filter option for accounts in line 51 and 52:
var FILTER_ACCOUNTS_BY_LABEL = false;
var ACCOUNT_LABEL_TO_SELECT = “INSERT_LABEL_NAME_HERE”;
So I tried to add this but it ain’t works.
var FILTER_CAMPAIGNS_BY_LABEL = true;
var ACCOUNT_LABEL_TO_SELECT = “Campaign QS Component Script”;
Is there another line I can add to use this campaign filter within the ad account?
Sachin Doshi
Hi Tim,
As you can see in the function getKeywordReport() we use data from KEYWORDS_PERFORMANCE_REPORT for the analysis. Unfortunately there is no provision to filter this data by campaign-label.
You can filter the data by keyword-label, though.
The changes you may need are –
var FILTER_CAMPAIGNS_BY_KW_LABEL = true;
var KW_LABEL_TO_SELECT = “Campaign QS Component Script”;
and then append to the where clause in the function getKeywordReport() as follows –
if (IGNORE_PAUSED_KEYWORDS) {
whereStatements += “AND Status = ENABLED “;
}
PS: Please note that every time you add new keywords, you will need to make sure that you apply the label to them.
Marie
Hi,
I have used this script for many years. The last time was on the 27th of September 2022.
Today I tried to run the script again in a new account, but it does not work any more. The follow errors occur:
InputError: undefined is not a filterable field.
at new iH (adsapp_compiled:17303:13)
at new zH (adsapp_compiled:17521:22)
at mI.report (adsapp_compiled:18189:12)
at nI.report (adsapp_compiled:18334:21)
at Object. (adsapp_compiled:19141:54)
Is there something changed? Thanks for your help!
Ketty
Hi,
I get this error when trying to run the script
Exception: Call to GoogleAdsService.Search failed: Error in WHERE clause: expected AND instead of -.
at adsapp_compiled:18690:138
at adsapp_compiled:18701:9
at sa (adsapp_compiled:236:15)
at Object.search (adsapp_compiled:244:20)
at adsapp_compiled:18819:26
at SI (adsapp_compiled:18852:15)
at SI (adsapp_compiled:18856:14)
at SI (adsapp_compiled:18856:14)
at RI.search (adsapp_compiled:18819:9)
at zI.search (adsapp_compiled:18386:19)
Sachin Doshi
Thank you for pointing this out. This is fixed now. Please download and use the latest script.