The Q4, 2015 Digital Marketing report by Merkle shares some insightful findings about how mobile traffic has risen, as a result establishing its foothold in the earlier desktop dominated space. This further stresses on how the users are going ‘all mobile’ and building their ‘moments’ there. If you haven’t yet explored mobile for your paid-search advertising, here are some findings that suggests that you must.
You can view the entire report here.
Here are some key highlights of the report that will stimulate some action:
1. Google’s paid search ad spend growth driven by Mobile
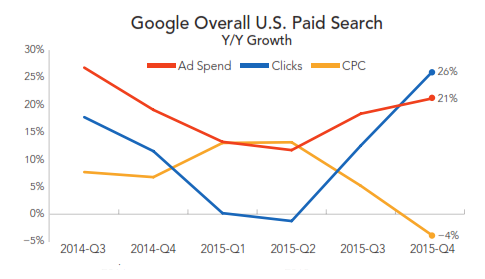
As a result of rise in mobile volume, the search ad spending grew by 21% YoY. In Q3, it was observed that the addition of more text ad inventory greatly impacted mobile traffic which has been continued in Q4 results as well. As a result, the clicks have risen by 26% YoY and average CPC have fallen down to -4%.
2. Google’s PLA clicks grow and CPC drops
In comparison to Bing, Google’s PLA witness a startling growth to 62% YoY from 39% growth in Q3. Here too most of the clicks were driven through mobile and hence the CPC fell 17%. The text ads, on the other hand witnessed a 6% increase in clicks and 2% increase in CPC.
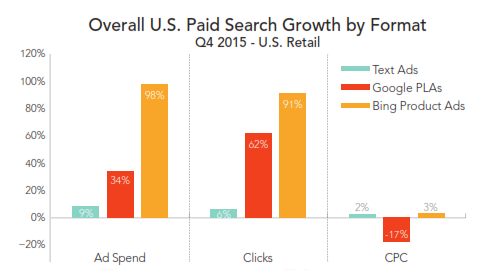
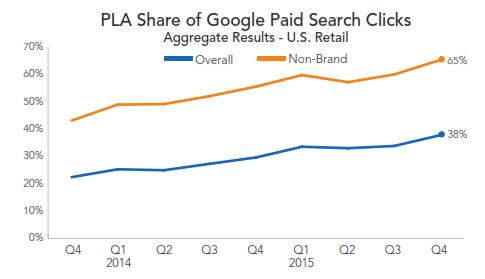
Also, due to the holiday season PLA’s produced 65% of non brand Google search ad clicks in Q4, with Apparel seeing its PLA share increase from 43% to 55%.
Though Bing also grew steadily with 26% of non search ad clicks, Google’s PLA growth is tremendous in comparison.
3. Organic search visits drops with mobile driving traffic through ads
Paid search and direct gained in traffic share, hence suggesting an increase in monetization of the search results page. Organic search fell 4% from 3% growth in Q3. All the more, Google’s share of US organic search results fell to 83% from 85% in Q3, whereas Bing and Yahoo gained upto a point in Q4.
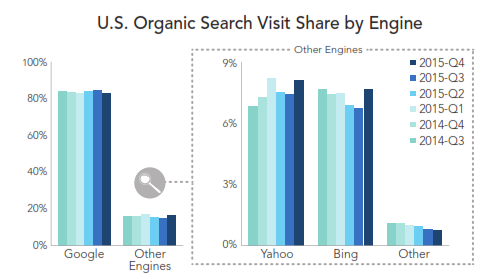
On the other hand, Google’s mobile organic search visits share dropped by a point to 88%, but the good news is that the mobile traffic was being driven through paid search. Phone visits were just up by 4% in Q4, in comparison to 63% growth in Q4.
4. Facebook leads in social media visits
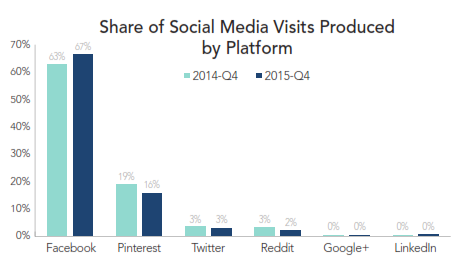
Social media drove 2.7% of site visits on an average in Q4, compared to 2.6% in Q3 which rose from the years lowest at 2.3% in Q2. Of all the social media platforms Facebook produced the maximum social media visits at 67% in Q4 compared to 63% in Q, 2015. The other platforms produced low traffic with Pinterest at 16% followed by Twitter at a stagnant 3% and Reddit at 2%, with Google+ and LinkedIn haven’t yet opened their window at 0%.
Related Articles:




Stop the wasted ad spend. Get more conversions from the same ad budget.
Our customers save over $16 Million per year on Google and Amazon Ads.