Tinuit’s Q3 2024 Benchmark Report sheds light on the latest digital advertising trends. Analyzing anonymized performance data from its managed campaigns, the report offers a deep dive into the performance of platforms like Google, Meta, Amazon, and more.
The complete report can be downloaded here.
A Concise Overview of Emerging PPC Trends
While digital marketing growth stalls on most major platforms, Amazon powers ahead, fueled by massive Prime Day investments
Google and Meta advertising faced the tougher Q3 as growth slowed. Facebook’s spending increased from 4% in Q2 to 5% in Q3, but Meta’s overall growth slowed, as Instagram’s spending rose 14% in Q3, down from 24% in Q2.
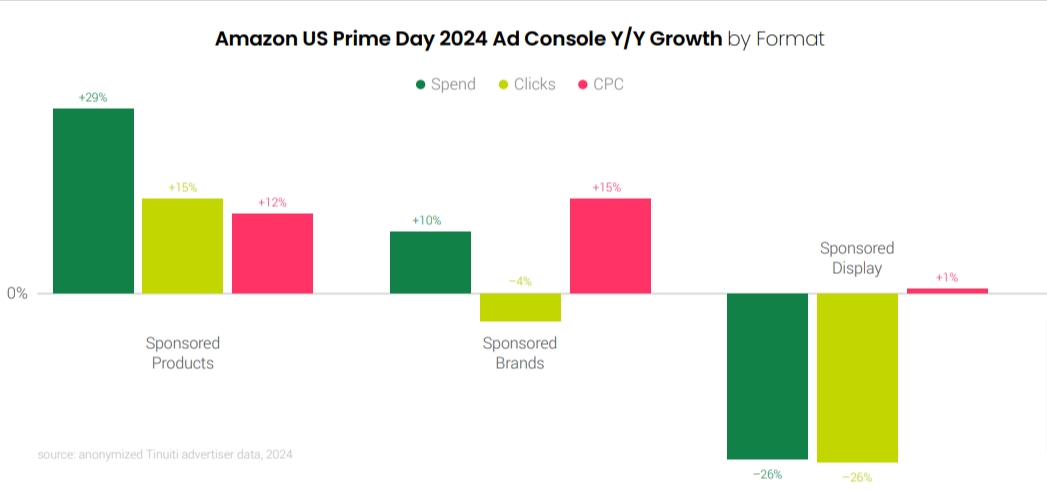
Amazon Sponsored Products grew significantly in Q3, jumping from 8% in Q2 to 15% in Q3. The strong performance was driven by a 29% increase in Sponsored Products spending during Amazon’s Prime Day event on July 16-17, compared to last year’s event.
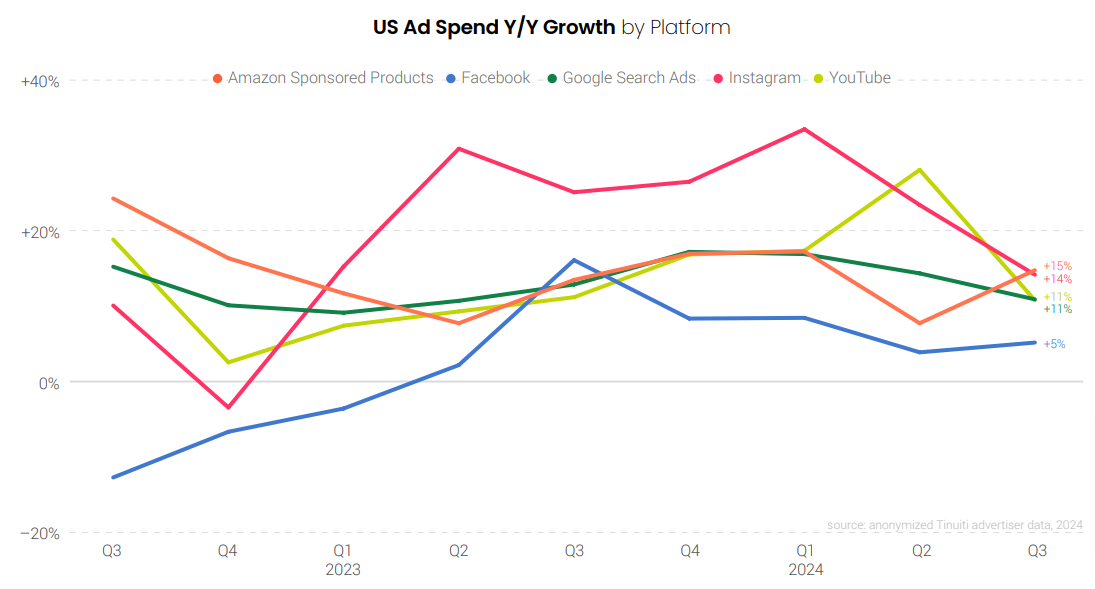
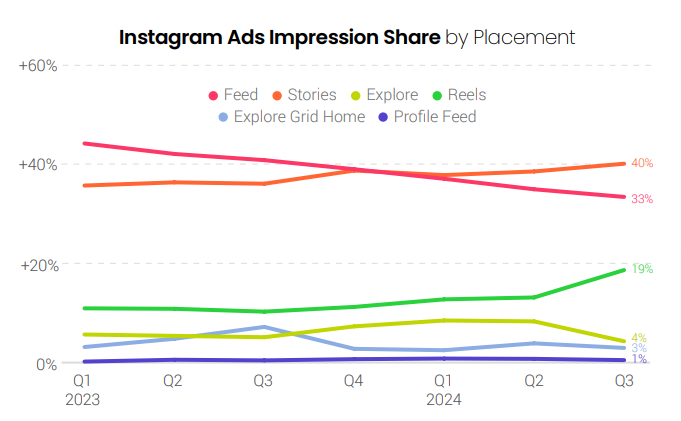
Instagram Reels made significant progress, increasing its share of impressions from 13% in the second quarter to 19% in Q3. Meanwhile, Google paid search advertising, encompassing text ads and shopping campaigns (including traditional Shopping and Performance Max), grew by 11%, down from 14% in the previous quarter.
Amazon Sponsored Products CPC rebounded from no growth in the second quarter to a 9% increase in Q3. Like spending trends, CPC grew even more during Prime Day, with a 12% rise in Sponsored Products CPC for Prime Day 2024 compared to 2023.
Instagram Surpasses Facebook in Ad Spend Growth
Meta ad spend grows 9%, Facebook CPM declines 12% and Instagram spend share creeps up to 36% in the third quarter
The cost of ad impressions on Facebook fell 12% year over year, but impression growth rebounded from 5% in Q2 up to 20% in Q3.
Advertisers increased their investment in Instagram by 14% year over year in Q3. Impressions declined 4% year over year, but pricing rose 19% year over year, the second straight quarter of double-digit increases.
Since their release from beta in 2022, AI-powered Advantage+ shopping campaigns (ASCs) have rapidly gained significance, and by Q3 2024, they made up 34% of all retail and e-commerce spending for Tinuiti advertisers.
Instagram Reels have played an important role in boosting ad impressions. Reels accounted for nearly one in five Instagram ad impressions in Q3 2024, almost doubling the 10% share from Q3 2023. This quarter also saw the largest quarter-to-quarter increase in Reels impression share ever recorded for Tinuiti advertisers.
Regarding Reels video ads and Reels overlay ads, Reels video ads saw a significant rise from the 12% of Facebook ad impressions. Reels overlay ads featured on top of Reels videos accounted for 16% of all ad impressions on Facebook.
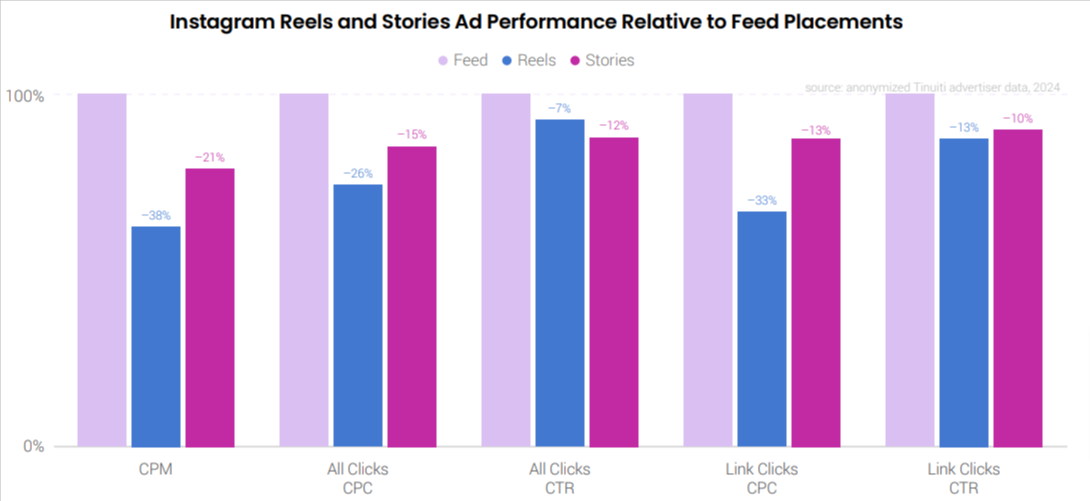
Instagram Reels CPM is still significantly below that of Instagram Feed, and in Q3 that difference was 38%. Stories ads also have significantly lower CPM than Feed, but Stories CPC for both link clicks and all clicks are much closer to that of Feed than Reels.
When it comes to Pinterest, the average cost of ad impressions dropped 17% year over year in Q3. Despite the decline in costs, ad spend on the platform increased by 12%, driven by a 35% surge in impressions compared to the same period last year.
Google Shopping and Non-Shopping PMax Campaigns Gain Momentum in Q3
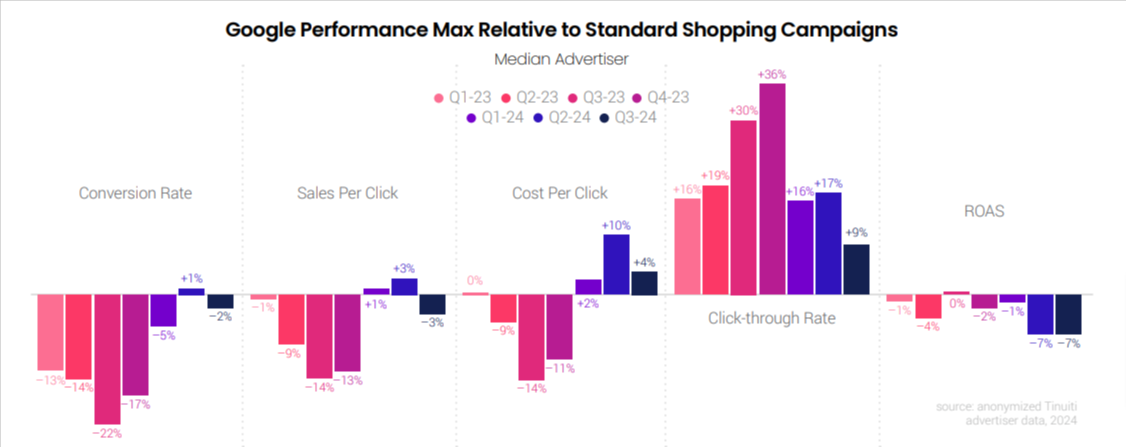
While Google Text ad spending growth has been driven primarily by CPC increases, PMax CPCs are coming down relative to Standard Shopping Campaign in Q3.
Spending on Google paid search ads rose 11% Y/Y in Q3 2024. The growth in average CPC decelerated from 12% year-over-year in Q2 to 8% in Q3. Search ad CPC had hit a low with a 1% year-over-year decline in early 2023, as economic uncertainty weighed down ad prices. Over the following year, CPC growth picked up as those concerns eased and now advertisers are up against strong year-over-year price comparisons.
With the increase in PMax’s share of non-shopping inventory, brands experienced a decline in conversion performance for PMax campaigns compared to standard Shopping campaigns. In Q3 2024, PMax conversion rates were 2% lower than those of SSCs.
This report evaluates the potential impact of Google’s AI overviews on ad click-through rates (CTR). While various factors can affect search ad CTR trends, the widespread rollout of Google’s AI overviews in May was followed by noticeable declines in CTR across several text ad segments.
Between April and July, the non-brand keyword segment on mobile devices experienced the steepest decline, with CTR dropping by 14%. However, during August and September, click-through rates rebounded across all device and keyword segments. Despite the recovery, the CTR for the non-brand mobile segment remains 4% lower than in April 2024.
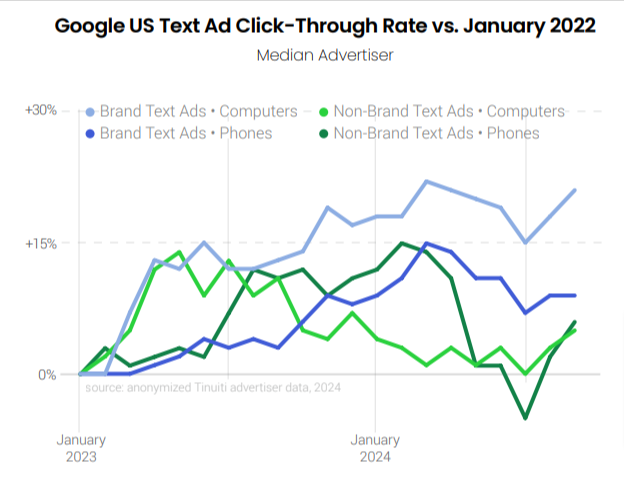
The average click-through rate for standard Shopping campaigns has held up well during Google’s AI overview rollout, with typical advertisers experiencing a 14% increase in CTR on mobile devices between April and September 2024.
Amazon Sponsored Brands and Products Surge Ahead with 15% Spend Growth
Prime Day contributed to a significant increase in Sponsored Products spend, which grew by 29%. Meanwhile, CPC for Sponsored Brands and Products rose by 12% and 9%, respectively.
Amazon advertisers increased their Prime Day investment in Sponsored Products by 29% year-over-year. The cost-per-click (CPC) for Sponsored Products and Sponsored Brands grew by 12% and 15% Y/Y, respectively, as advertisers vied for high-intent shoppers.
Walmart Sponsored Products spend grew 20% and CPC has risen 20% in Q3. The increase in CPC is the slowest growth observed since Q2 2023.
In August 2024, CPC growth for Walmart Sponsored Products ads slowed to 14%, marking the slowest growth rate since May 2023. However, it rebounded to 26% in the final month of the quarter.
Walmart Sponsored Videos are becoming increasingly important for advertisers. In Q3 2024, Sponsored Products dominated Walmart’s search ad spend, capturing 92% of the total, while Sponsored Brands made up the remaining 4%.
Google Display Network: Here’s What You Need to Know
Google Display Network (GDN) saw a 10% year-over-year increase in revenue, while impressions declined by 1%. The average CPM for the GDN rose by 11% year-over-year during the same period.
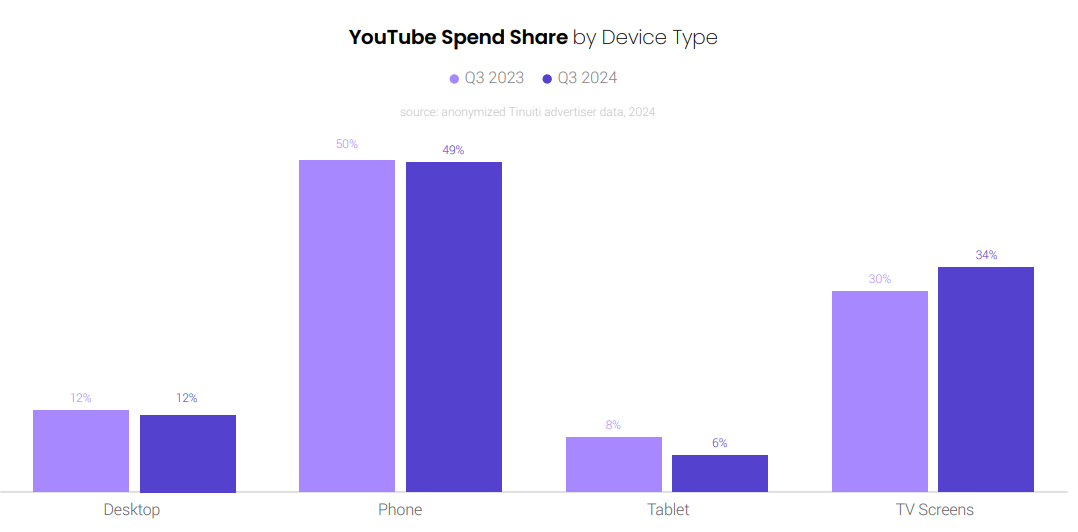
In Q3 2024, spending on YouTube ads increased by 11%. TV screens made up 34% of the total YouTube ad spending. While ad spending on phones rose by 10%, the share of spending on phones dropped slightly from 50% in Q3 2023 to 49% in Q3 2024. Tablets experienced the largest decline, with their share of ad spending falling from 8% in Q3 2023 to 6% in Q3 2024.
TV screens drove 59% of traditional streaming ad spending, while mobile devices, including phones and tablets, made up 31%. Desktop computers accounted for 10% of traditional streaming ad spending and 13% of spending on real-time bidding (RTB) ads.
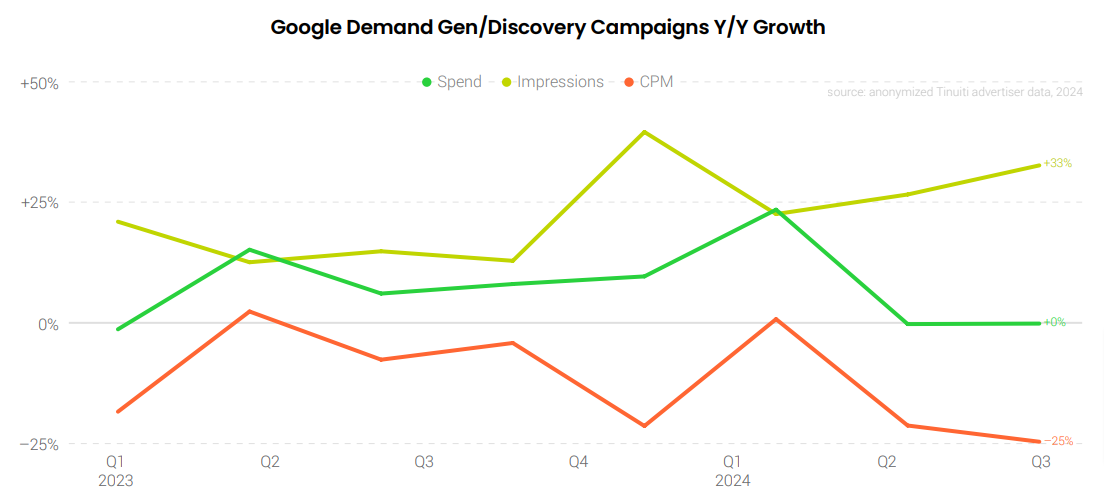
Although Google Demand Gen campaigns were widely adopted in Q3, advertisers who stayed active saw no spending growth for the second quarter in a row. While impressions grew significantly year-over-year, these gains were offset by a sharp drop in average CPM.
During Amazon Prime Day 2024, which took place on July 16 and 17, advertisers increased their DSP spending by 143% compared to Prime Day 2023. Brands not only invested heavily during the event itself but also boosted spending in the days leading up to it, aiming to engage shoppers ahead of the two-day sale.
Once again, click here to download the complete report.
Related Links


Stop the wasted ad spend. Get more conversions from the same ad budget.
Our customers save over $16 Million per year on Google and Amazon Ads.