The Q4 2024 Benchmark Report from Tinuiti reveals the latest trends shaping digital advertising. Leveraging anonymized campaign data, the report provides a platform-by-platform breakdown—including Google, Meta, and Amazon—helping brands stay ahead in a competitive landscape.
The complete report can be downloaded here.
Market Insights: Yearly & Holiday Trends
Meta-owned properties saw a 15% year-over-year spend growth, while other major platforms struggled with tougher comparisons in Q4 2024.
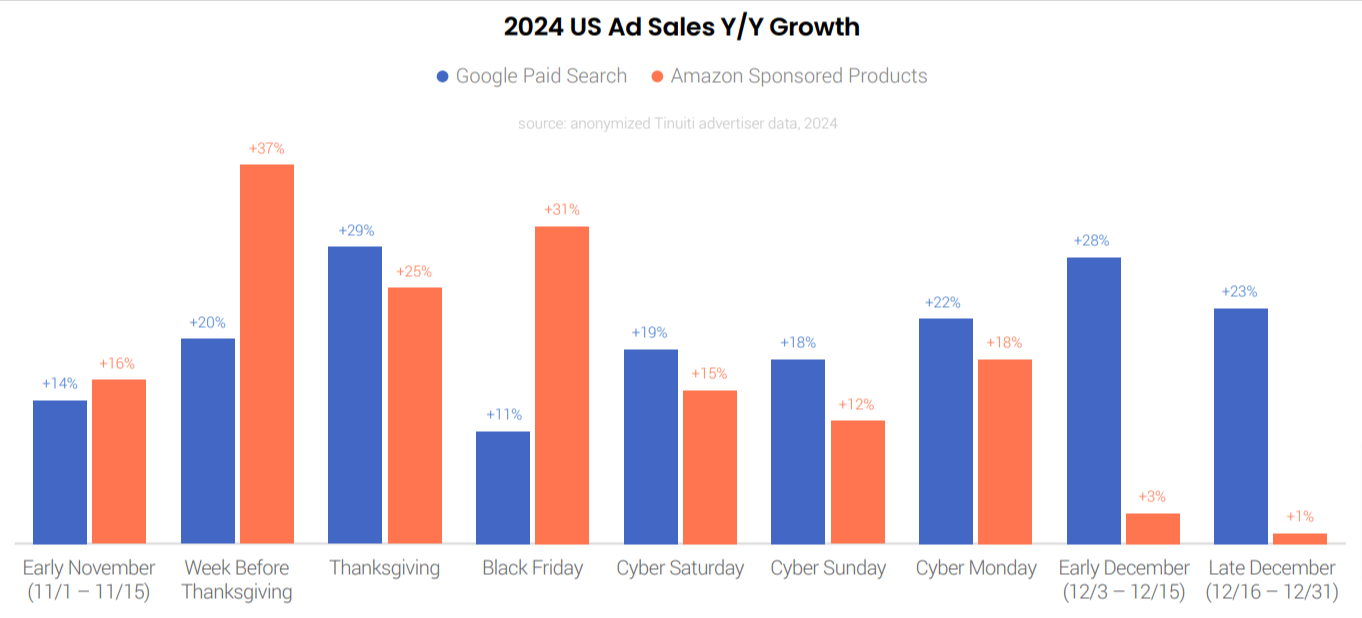
Meta’s Facebook and Instagram saw faster spend growth in Q4, with overall Meta spending up 15% year over year, compared to 9% in Q3. Meanwhile, platforms like Google paid search, Amazon Sponsored Products, and YouTube faced tougher year-over-year comparisons.
During Thanksgiving, Amazon Sponsored products saw a 37% jump in sales. Growth was also strong for Google search sales, which grew 20% year over year in the week leading up to Thanksgiving.
In 2024, US Google Shopping advertisers still faced strong competition from Amazon, but Temu scaled back its presence during the holiday season. Temu’s impression share in Google Shopping auctions dropped from 23% in Q4 2023 to 11% in Q4 2024, with fewer Tinuiti advertisers seeing it in auctions.
Google & Microsoft Search Ads see CPC-Driven Growth
Total spending on Google search ads rose 10% yearly, while the average CPC increased 7% in Q4 2024.
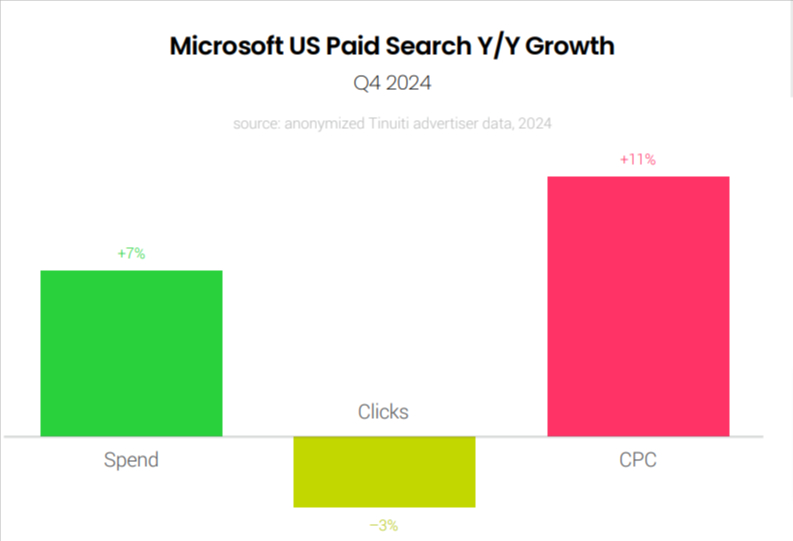
Like Google search ads, Microsoft search ads—including Performance Max, shopping, and text ads—experienced a 7% year-over-year spending increase in Q4 2024. With the average Microsoft search ad CPC rising by 11%, the platform saw stronger growth in pricing than in volume.
Due to Amazon being aggressive in auctions, Google Shopping ad click growth reached only 1% year over year in Q4 2024, while average shopping ad CPC growth held steady at 9% Y/Y.
By the end of 2024, over 95% of retail advertisers running shopping ad listings with Google had adopted Performance Max campaigns. For advertisers using both Performance Max and standard Google Shopping campaigns, PMax made up 69% of shopping ad spend for the median retailer in Q4 2024.
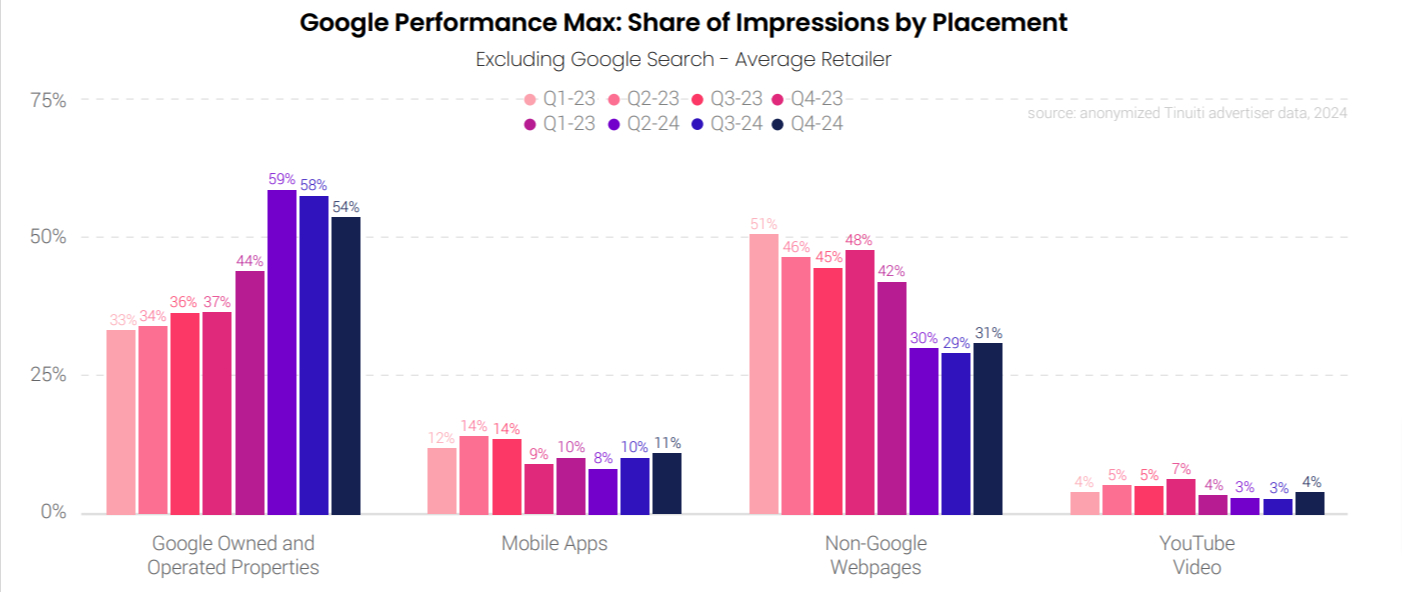
Google continues to lead in generating PMax impressions outside of its search property. In Q4 2024, YouTube contributed 4% of these non-search PMax placement impressions, while other Google-owned platforms made up 54%.
Facebook & Instagram Spending Gains Momentum in Q4 2024
In Q4, Instagram ad investment grew 20% compared to last year, up from a 14% increase in Q3. CPM rose 15%, marking the fifth quarter of growth.
The growth in spending on Meta’s largest platform accelerated from 5% in Q3 to 11% in Q4. This 11% increase in Q4 marks the fastest growth on Facebook since Q3 2023.
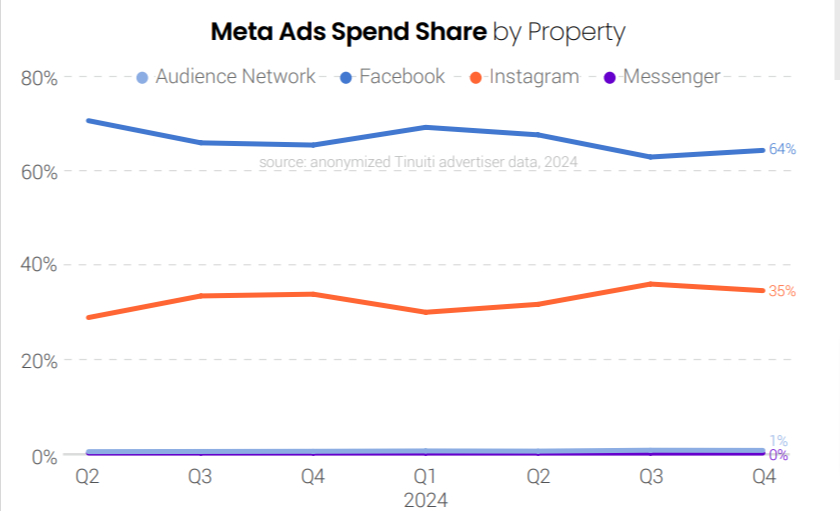
Although Instagram’s portion of Meta’s total ad spend increased year-over-year, Facebook remains the dominant platform for Meta, representing 64% of the spend in Q4 2024.
The share of spending on Advantage+ shopping campaigns remained consistent in the final quarter. In Q4 2024, retail and e-commerce advertisers allocated 34% of their Meta budget to Advantage+ shopping campaigns (ASCs).
Reels video ads made up 11% of all Facebook ad impressions in Q4 2024. Meanwhile, Reels overlay ads—banner and sticker ads displayed over Reels videos—contributed an additional 16% of impressions, a significant increase from 5% in Q4 2023.
Amazon Sponsored Products & Brands Saw Mixed CPC Trends
Amazon’s primary search ad clicks cost 2% less in Q4 year over year. Spending on Sponsored brand ads remained unchanged, despite a 15% drop in clicks and a 17% rise in cost per click (CPC).
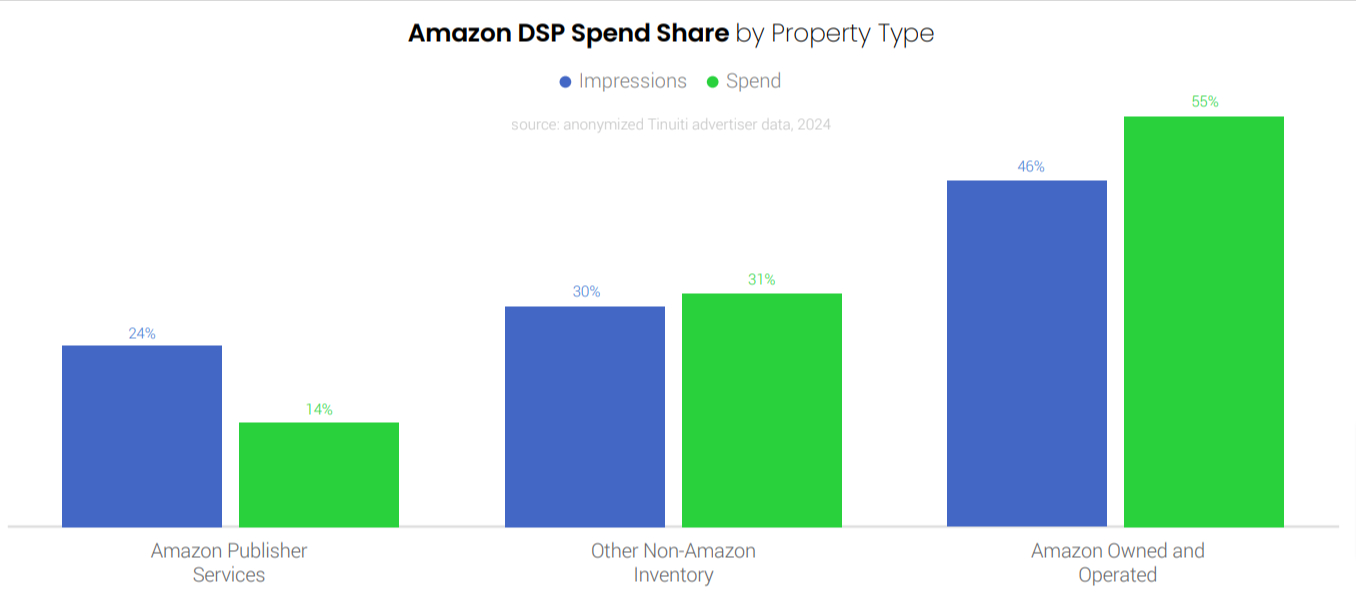
In Q4 2024, 55% of Amazon DSP spend went to Amazon’s own platforms, 14% to Amazon Publisher Services, and 31% to other non-Amazon inventory.
The increase in spend for Walmart Sponsored Products was largely driven by growth in CPC, which rose 51% in the fourth quarter. In the last quarter of 2024, 68% of Walmart’s display advertising spend was allocated to inventory on its website and app, while the remaining 32% was directed toward placements outside of Walmart-owned properties.
Advertiser Investment in YouTube Video Ads Grows, CPM Drops in Q4 2024
While YouTube ad impressions surged by 28% Y/Y in Q4 2024, advertiser spending growth slowed to 7%, down from 11% in Q3.
Despite strong impression growth—rising from 23% Y/Y in Q3 to 28% in Q4—YouTube’s average CPM declined by 16% Y/Y. The evolving ad landscape offers advertisers more ways to buy inventory, including YouTube Select reserved buys, Performance Max, and Demand Gen campaigns.
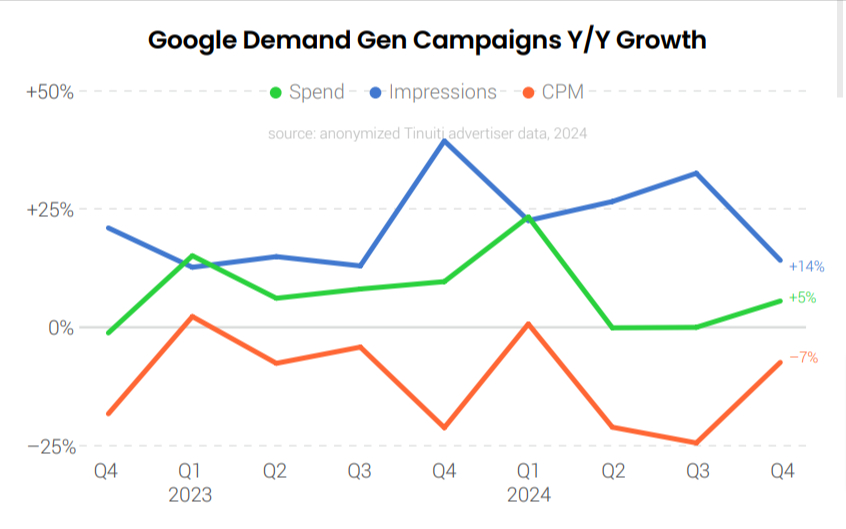
Despite a sharp rise in the adoption of Google Demand Gen campaigns in Q4 2024, existing advertisers showed only modest spending growth. Same-site investment in these campaigns rose just 5% year-over-year, a slight uptick after flat performance in previous quarters. Meanwhile, impressions surged 14% Y/Y, driven in part by a 7% decline in average CPM.
Despite a 10% decline in average CPM, advertiser spending on Google Display Network campaigns rose 11% year-over-year in Q4 2024, highlighting a shift toward more cost-effective impressions.
Once again, click here to download the complete report.
Related Links


Stop the wasted ad spend. Get more conversions from the same ad budget.
Our customers save over $16 Million per year on Google and Amazon Ads.