Fuel your digital ad strategy with Tinuiti’s Q3 report. This data-driven analysis of Google, Meta, Amazon & more, based on anonymized campaigns, provides actionable insights for informed decisions.
The complete report can be downloaded here.
Google Paid Search: CPCs surging across devices and retailers
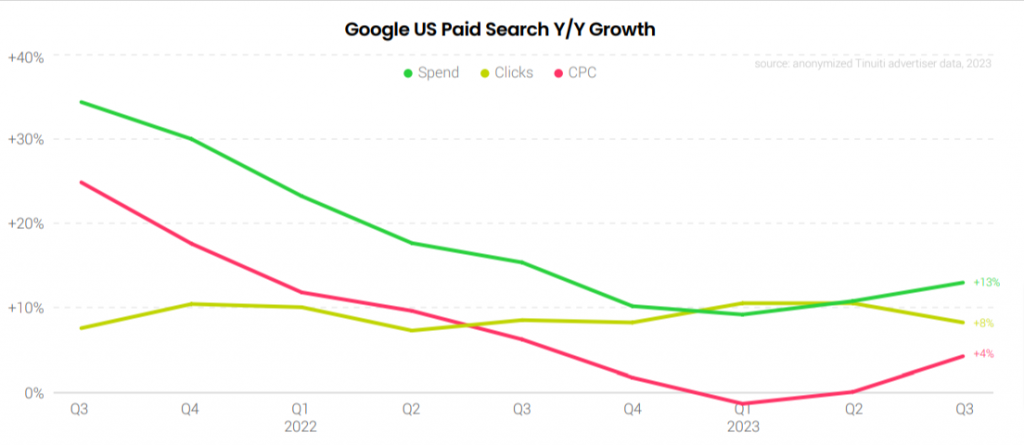
Spending on Google search and Shopping ads in the US increased for the second quarter in a row, rising by 13% year-over-year in Q3 2023. Although the growth in clicks decelerated from 11% in Q2 to 8% in Q3, there was a notable four-point increase in CPC growth during the same timeframe.
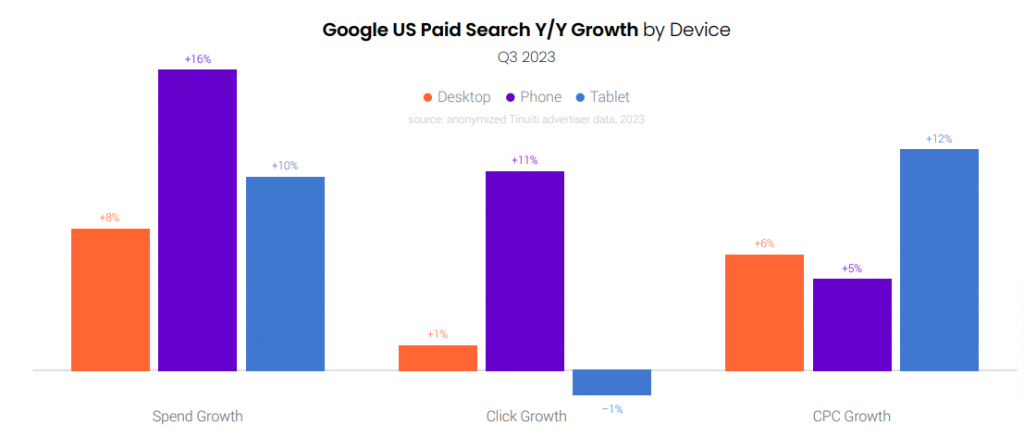
Desktops and tablets followed a similar playbook, with CPCs powering 8% and 6% spending increases. Phones, however, shone for cost-conscious advertisers, delivering 11% click growth with only a 5% rise in CPCs.
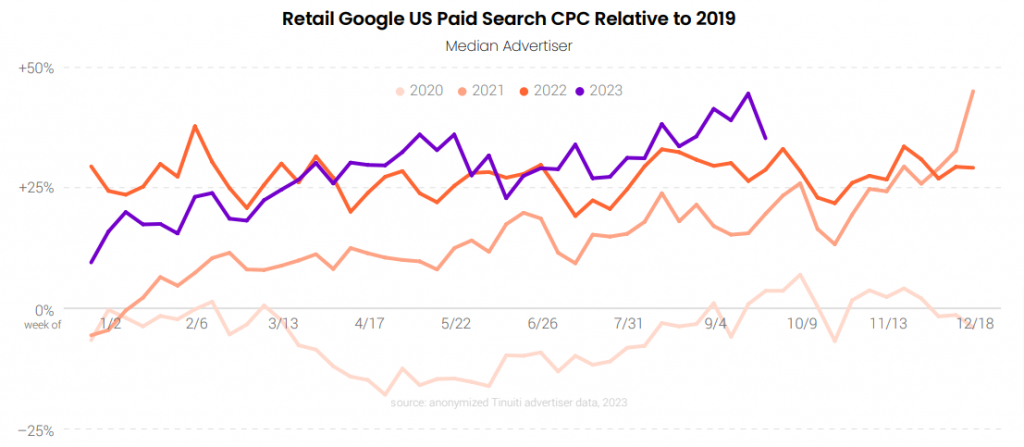
Throughout Q3 2023, retailers experienced a rise in Google search CPC increases. In comparison to 2019, retailer CPCs saw a 35% increase in Q3 2023, up from 30% in Q2 2023 and a 27% rise over 2019 in Q3 2022. By the conclusion of Q3 2023, retailer CPCs had surged by 45% compared to levels before the pandemic.
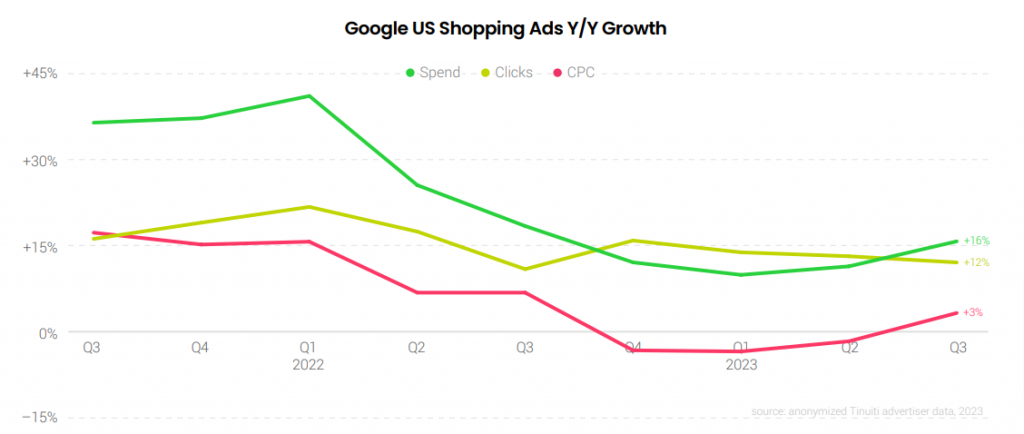
Expenditure expansion for Google Shopping and Performance Max campaigns surged to 16% year-over-year in Q3 2023. Although Shopping ad click growth decelerated by one point to 12% year-over-year, there was an upturn in CPC growth, shifting from a 2% year-over-year decline in Q2 to a 3% year-over-year increase in Q3.
Google text ad spending maintained its momentum in Q3 2023, growing 11% year-over-year. Although text ad click growth slowed from 7% Y/Y in Q2 to 2% Y/Y in Q3, there was an acceleration in CPC growth from 3% Y/Y in Q2 to 8% Y/Y in Q3. Notably, this marked the 13th consecutive quarter where Google’s text ad CPC growth surpassed its Shopping ad CPC growth.
Facebook, Meta & Instagram’s ad spending EXPLODED in Q3
Expenditure on Meta properties showed a robust 19% year-over-year increase in Q3, marking the highest growth for Tinuiti advertisers since Q4 2021. Impressions continued to grow significantly at 46% during the third quarter, while CPM experienced a decline of 19%.
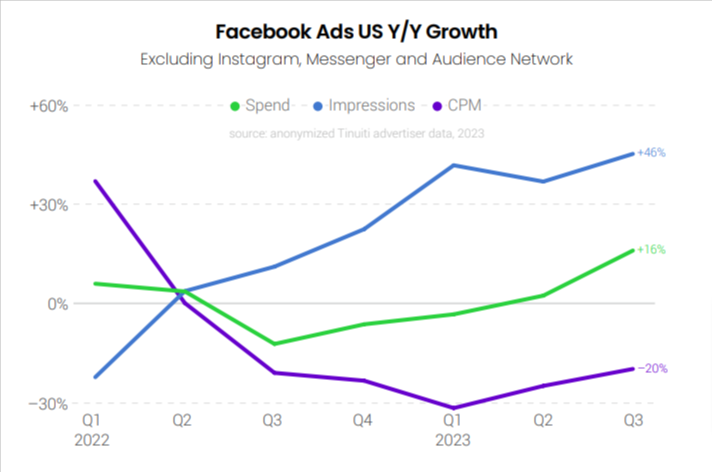
For Facebook, excluding Instagram, Messenger, and Audience Network, spending increased by 16% year over year. Impressions also surged by 46% in Q3, accompanied by a year-over-year CPM decline of 20%.
Over the past year, advertisers have observed robust results from Advantage+ shopping campaigns. In Q3 2023, retail advertisers allocated 23% of their total Meta investment to Advantage+ shopping campaigns, marking an increase from 19% in Q2.
Although Reels overlay ads were recently introduced to Instagram in Q2 2023, they have progressively gained significance for Facebook over the past six quarters. In Q3, Reels overlay ads constituted 8% of all Facebook ad impressions, twice the 4% share held by Reels video ads.
Spend for Amazon Sponsored & Brand Products rises with stronger CPC growth
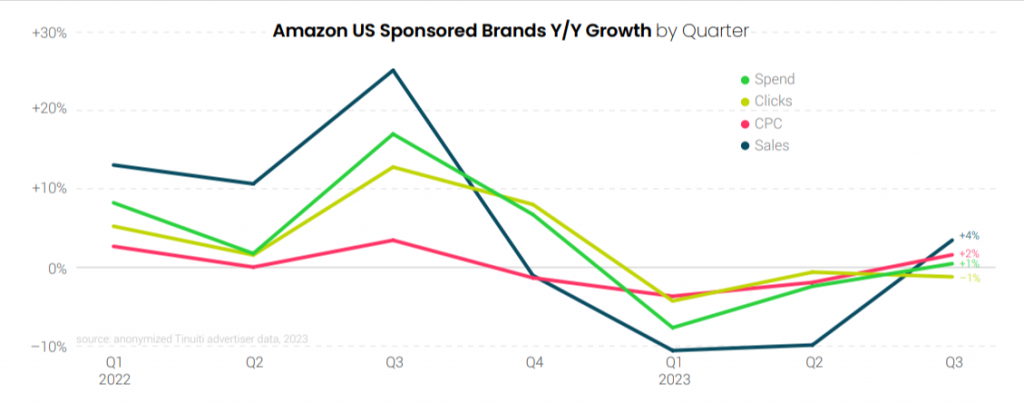
Spending on Amazon’s Sponsored Products rose by 14% year over year in Q3, with CPC growth increasing from 3% in Q2 to 8% in Q3. Advertisers also increased their investment in Sponsored Brands by 1% year over year in Q3. Despite a 1% decline in clicks in Q3 (similar to Q2), there was a CPC turnaround, shifting from a 2% decline in Q2 to a 2% growth in Q3.
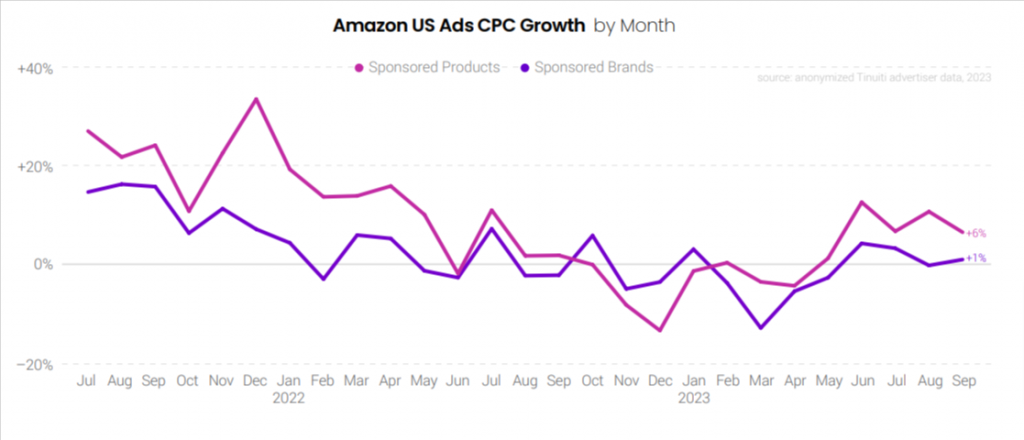
In September, the year-over-year increase in CPC was 6% for Sponsored Products and 1% for Sponsored Brands. Analyzing the 48-hour Prime Day event in July, both Sponsored Products and Sponsored Brands witnessed a 9% CPC rise compared to the previous year’s event, showcasing even stronger growth than observed for these formats over the entire quarter.
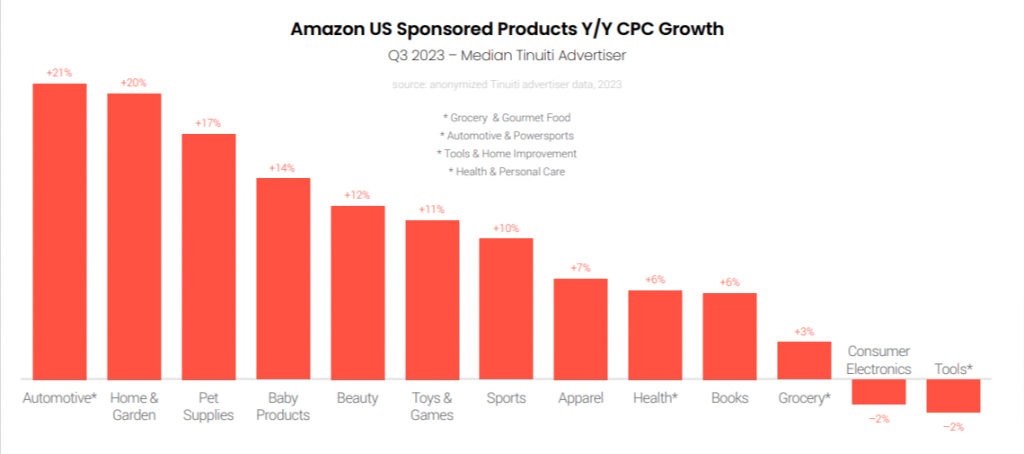
Out of the thirteen product categories examined in this report, ten showed greater CPC growth in Q3 than in Q2. Automotive and power sports brands had the highest year-over-year increase, jumping by 21%, followed by home and garden advertisers at 20%. In contrast, tools and home improvement brands had the smallest CPC decline, decreasing by only 2%.
Walmart advertisers observed a CPC growth jump for Sponsored Products. Click growth slowed from 45% in Q2 to 17% in Q3, but CPC growth jumped from a 4% decline to a 33% increase as advertisers overtook the first full year-ago quarter.
GDN Outshines YouTube: CPMs Soar on One, Sink on the Other
YouTube impressions kept growing strongly, but the average CPM has consistently dropped since Q2 2022. In Q3 2023, YouTube CPMs fell by 18%. However, YouTube advertisers, active in Q3 2022 and Q3 2023, saw an 11% year-over-year spending increase.
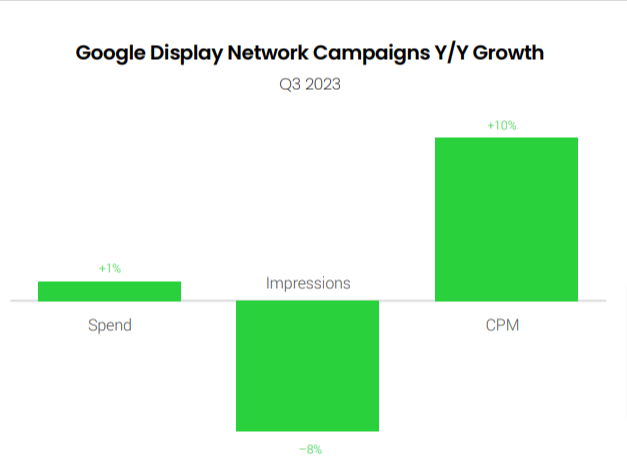
In Q3 2023, spending on Google Display Network ads increased by 1% year over year. GDN impressions declined by 8% year over year in the same period, while the average CPM rose by 10%.
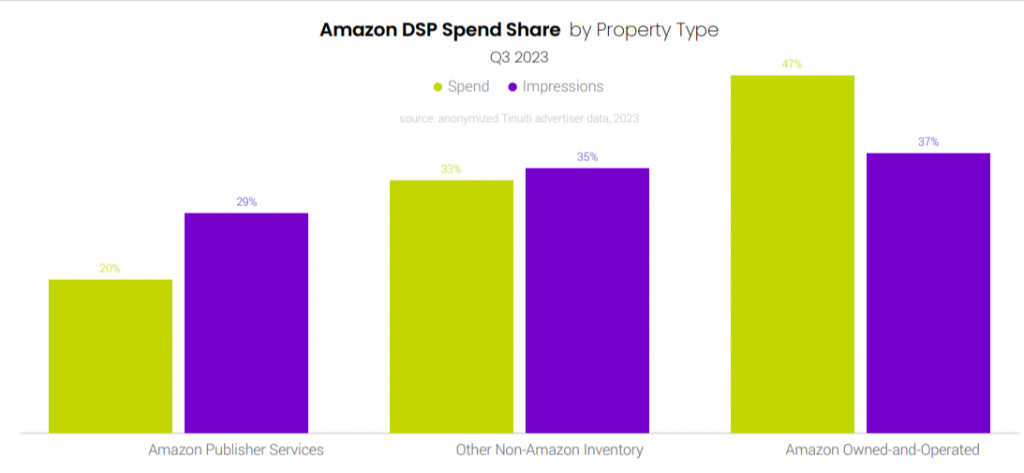
Amazon DSP has a higher CPM for Amazon-owned properties. In Q3, 47% of Amazon DSP ad spend went to Amazon-owned-and-operated (O&O) properties, but only 37% of impressions came from there. Amazon Publisher Services inventory comprised 20% of Q3 Amazon DSP spend, and the remaining 33% came from other non-Amazon inventory.
Phones still dominate the majority of Amazon DSP spending. Tablets increased from 7% of spending in the last Q3 to 11% this Q3, and televisions slightly increased from 6% to 7%. The role of video is progressively growing in Amazon DSP advertising, contributing to the rise in television share.
Once again, click here to get the complete Digital Ads Benchmark Report.
Related Links





Stop the wasted ad spend. Get more conversions from the same ad budget.
Our customers save over $16 Million per year on Google and Amazon Ads.