Tinuiti’s Q4 report delivers actionable strategies to boost your digital ad performance. Dive into in-depth analytics from Google, Meta, Amazon, and beyond.
The complete report can be downloaded here
PPC Trends: A Quick Overview
Compared to the strong performance from a year ago, most major US digital ad platforms experienced slower year-over-year spending growth in Q2 2024 than in the previous quarter.
Among Amazon Sponsored Products, Facebook, Google Search, Instagram, and YouTube, only YouTube saw faster spending growth from Q1 to Q2. Instagram’s growth slowed to 24% Y/Y, while Facebook’s growth decreased to 4% in Q2 from 9% in Q1.
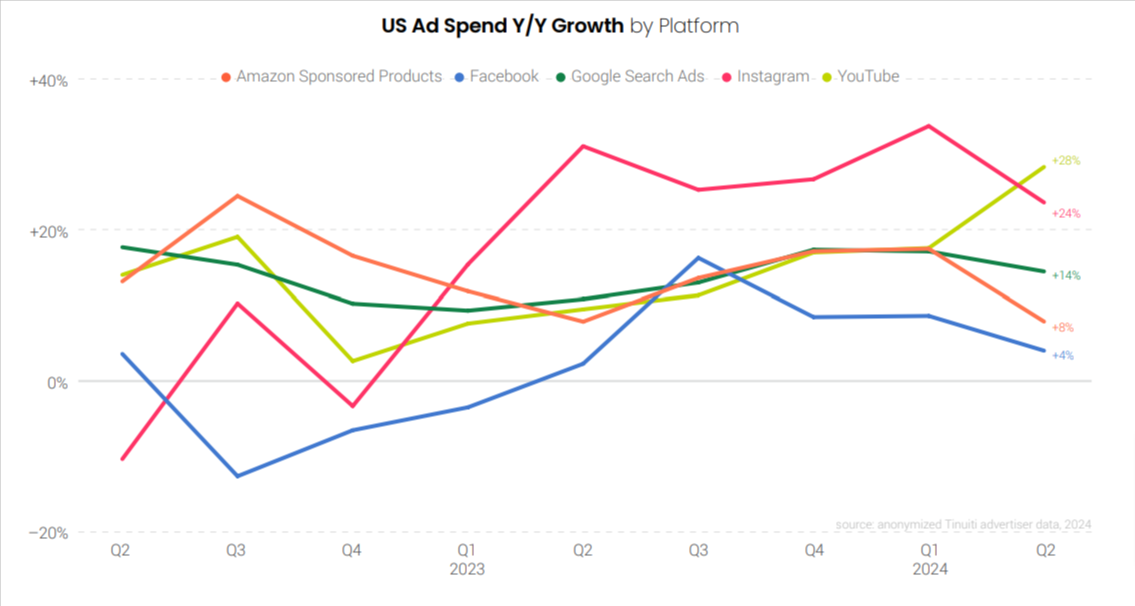
Ad pricing trends varied among the five major digital ad platforms in Tinuiti’s Q2 report. Facebook and Instagram experienced stronger pricing growth, whereas Amazon Sponsored Products, Google Search, and YouTube saw weaker pricing growth in Q2 compared to Q1.
Pricing was steadier on the two largest platforms with Google search ads seeing CPC growth decelerate by a point and Facebook ads seeing CPM growth accelerate by a point.
Meta Ads CPM Growth Outshines Facebook’s Decline
The cost of Meta’s ad impressions increased by 5% year over year, marking the largest quarterly rise since Q2 2022, while impressions grew by only 4%, the slowest rate during the same period.
While Meta ads CPM grows at the fastest rate in two years, Facebook CPM slipped just 1% year over year
in Q2 2024.
Advertisers boosted investment in Instagram ads by 24% year over year in Q2 2024, with CPM rising 23% in the second quarter, marking the largest quarterly increase since Q1 2022.
Advantage+shopping campaigns automate many aspects of ad creation and creative optimization. It made up 23% of all Meta ad spending for retail advertisers in Q2 2024, up from 19% in the same period last year.
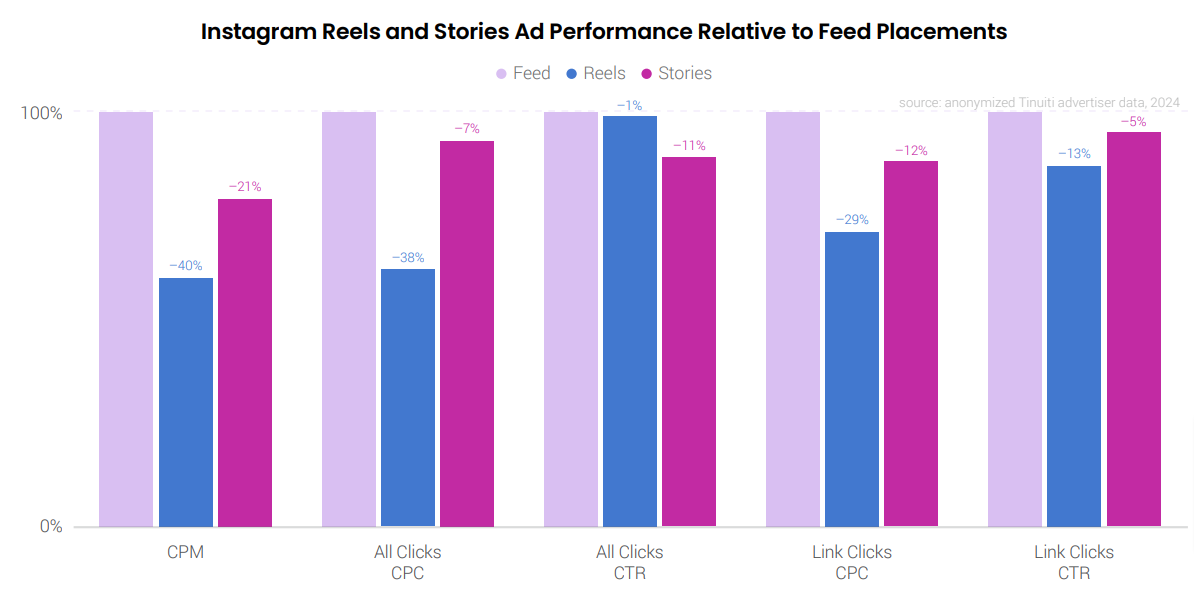
In Q2, Instagram Reels video ad impressions cost 40% less than Feed ads, a smaller difference than the 46% gap in Q1 2024 and Q4 2023. Interestingly, the ‘all clicks’ CTR of Reels ads nearly matched Feed ads in Q2, compared to being 15% lower in Q1.
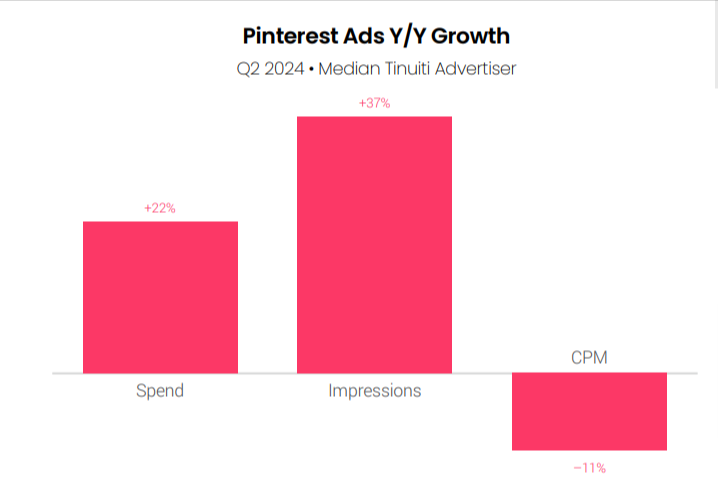
Pinterest is introducing several AI-powered tools, including Performance+ campaigns, which provide automation features similar to Meta’s Advantage+ campaigns. In light of these tools, Pinterest ad spend jumped 22% year over year in Q2 2024, with a 37% increase in impressions and an 11% decrease in the average cost of impressions for the median Tinuiti advertiser.
CPC Growth Drives Significant Rise in Google Search Ad Spend
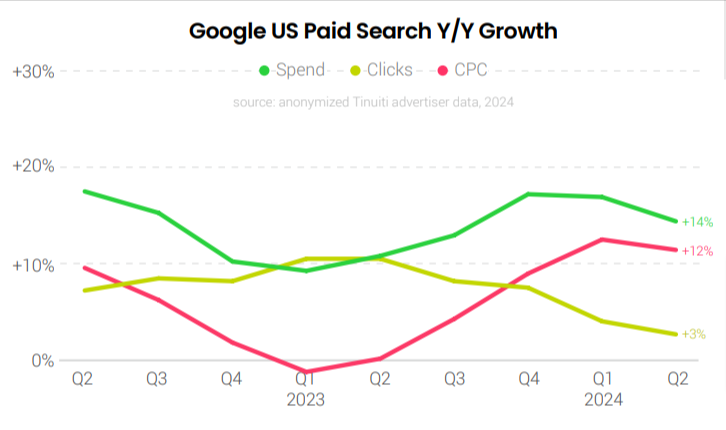
Text ad click growth was a mere 0.3%, marking the fourth consecutive quarter with less than 3% growth. However, CPC growth remains elevated.
Advertiser spending on Google search ads rose by 14% year-over-year in Q2 2024, down from 17% growth in the previous quarter. Click growth slowed for the fifth consecutive quarter, increasing by only 3% in Q2. On the pricing side, brands saw some relief as CPC growth slowed to 12% year-over-year after four quarters of accelerating rates.
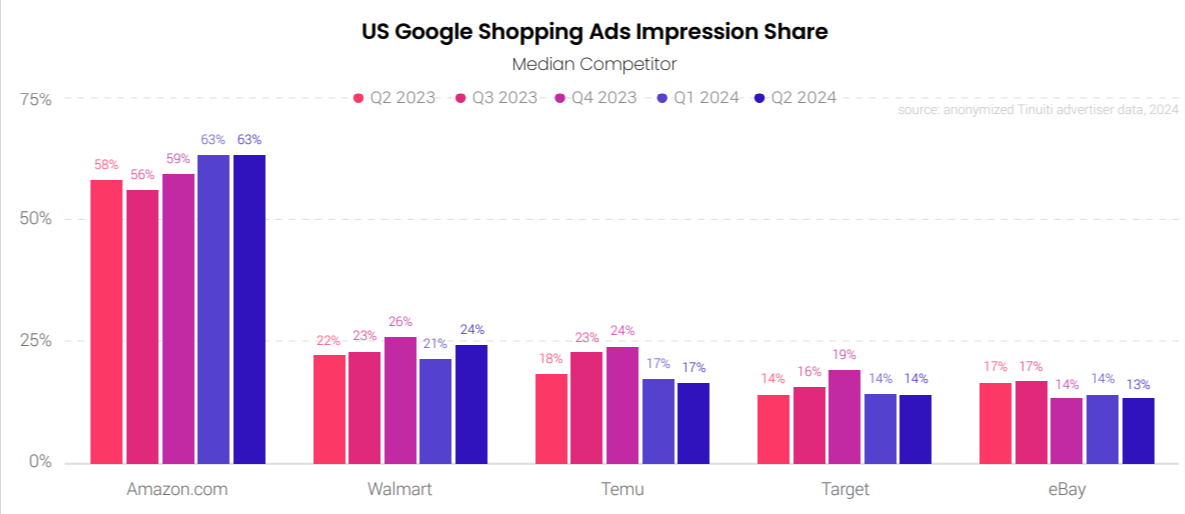
In the last week of 2023, over 90% of retailers viewed Amazon and Temu as top competitors for Google shopping impressions. While Amazon’s presence has remained steady, the percentage of retailers seeing Temu as a competitor dropped to 63% at the beginning of Q2 2024. Despite Temu’s significant investment in Google and other digital ads, its share of Google shopping impressions has been much smaller than Amazon’s over the past year.
In Q2 2024, brands using PMax campaigns saw higher conversion rates than those using standard Google Shopping campaigns for the first time. Three quarters earlier, PMax conversion rates were 22% lower than standard Shopping campaigns (SSCs). However, the cost per click (CPC) for PMax campaigns increased and was 10% higher than standard Shopping campaigns in Q2. Overall, the return on ad spend (ROAS) for PMax was 7% lower than for standard Shopping campaigns in Q2, compared to being roughly equal in Q3 2023.
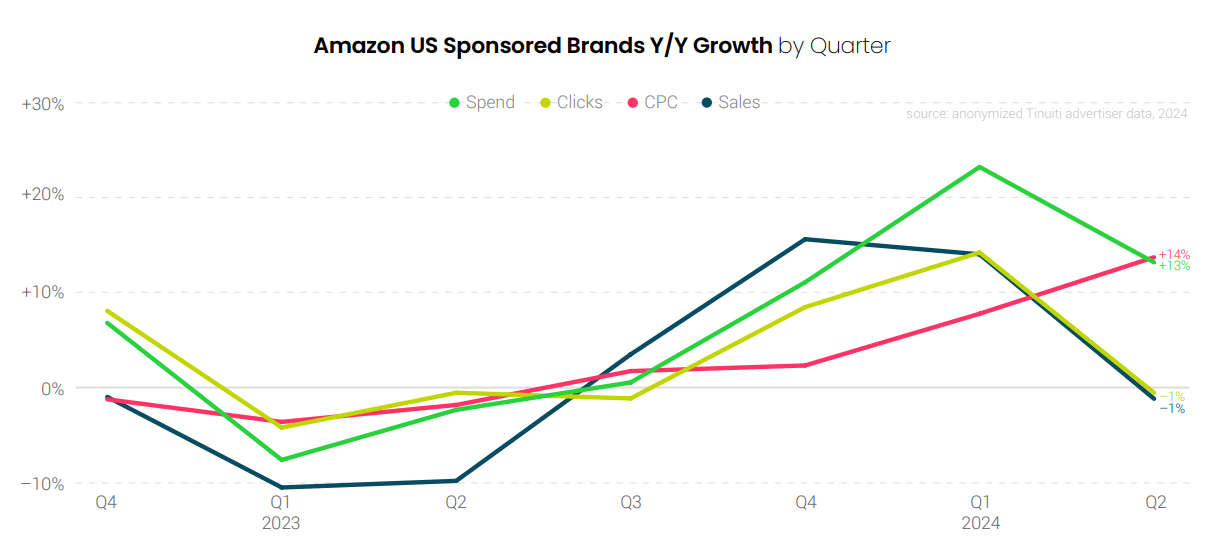
CPCs Hold Steady for Walmart Sponsored Products and Amazon Sponsored Brands
Clicks for Sponsored Brands, including video ads, rose in Q2, outpacing Sponsored Products’ CPC growth. Walmart’s Sponsored Products CPC growth also saw some boost.
Clicks for Sponsored Brands, including video ads, increased by at least 10% each month in Q2, surpassing the CPC growth for Sponsored Products. Walmart’s Sponsored Products CPC growth surged from 23% in May to 32% in June 2024.
For the second consecutive quarter, advertiser investment in Sponsored Brands campaigns, including video ads, grew more rapidly than in Sponsored Products. CPC for Sponsored Brands campaigns increased by 14% year-over-year in Q2, the fastest growth since Q3 2021
Advertisers boosted spending on Walmart Sponsored Products ads by at least 30% year-over-year. CPC increased by 30% in Q2 2024 compared to last year’s quarter, marking the slowest growth in the past four quarters. Despite the CPC rise, advertisers are still experiencing a strong return on investment, with sales attributed to Walmart Sponsored Products up 39% year-over-year
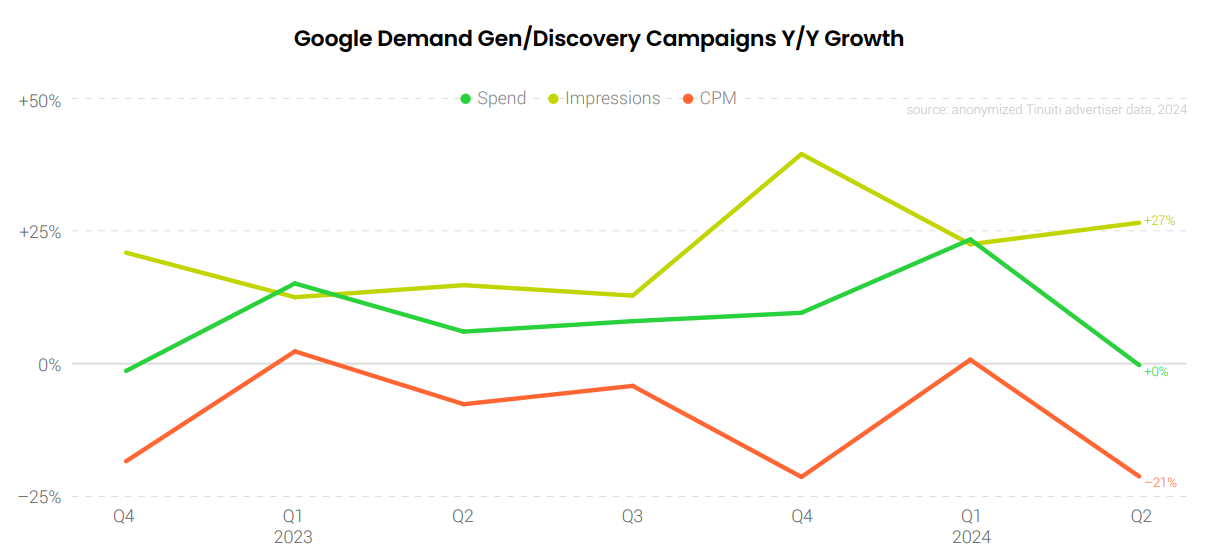
Google Demand Gen and YouTube Video Ad CPMs See a Drop
New impressions from YouTube video ad campaigns were relatively cheap, driving the average CPM down 26% year-over-year in Q2, compared to a 3% decline in Q1.
Spending on YouTube video ad campaigns increased by 28% year-over-year in Q2 2024, up from 18% in the previous quarter. The influx of new impressions, which were relatively inexpensive, drove the average CPM down by 26% year-over-year in Q2, compared to a 3% decline in Q1.
For advertisers who have consistently run Google Discovery/Demand Gen campaigns over the past year, spending growth remained flat year-over-year in Q2 2024, a significant drop from 24% growth in Q1. Although Demand Gen impression growth increased to 27% year-over-year, average CPM shifted from a 1% rise in Q1 to a 21% decline in Q2.
Advertiser spending on the Google Display Network (GDN), including display, app, and video inventory, was up 11% Y/Y in Q2 2024. GDN CPM growth slowed from 12% Y/Y in Q1 to 7% Y/Y in Q2 as the pricing comp from a year earlier strengthened.
Once again, click here to download the complete report.
Related Links


Stop the wasted ad spend. Get more conversions from the same ad budget.
Our customers save over $16 Million per year on Google and Amazon Ads.