Amazon Attribution allows sellers to track the impact of external advertising, such as Google Ads, on their Amazon product sales. By using Amazon Attribution, you can measure how effective your Google Ads campaigns are in driving traffic and sales on Amazon.
Karooya launched its Amazon Attribution Tool last year keeping those users in mind who use Google Ads to promote their Amazon products.
A Glimpse Inside Our Attribution Tool
Keywords are the foundation of targeted ad delivery. Imagine knowing precisely which keywords are turning clicks into customers. Marketers can analyze sales at the campaign and ad group levels, but tracing specific keywords to individual clicks is challenging. If advertisers could identify which keywords drive sales, they could optimize their strategy by increasing bids. However, if you need to identify the specific keyword driving sales, Amazon’s Attribution feature won’t offer that level of tracking.
Our Amazon Attribution Tool can help you with that by using these three features:
1. Keyword Level Tracking: Karooya offers support for keyword-level analysis. This allows advertisers to track sales performance by keyword, offering detailed insights into which keywords drive conversions.
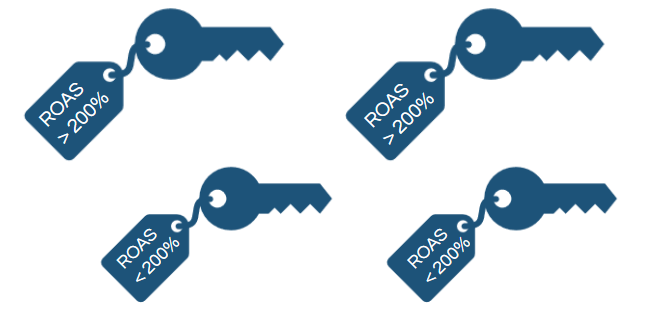
2. Keyword Label Assistance: Our keyword labelling system, driven by ROAS, provides insights for adjusting bids on Google Ads to optimize your campaign’s efficiency.
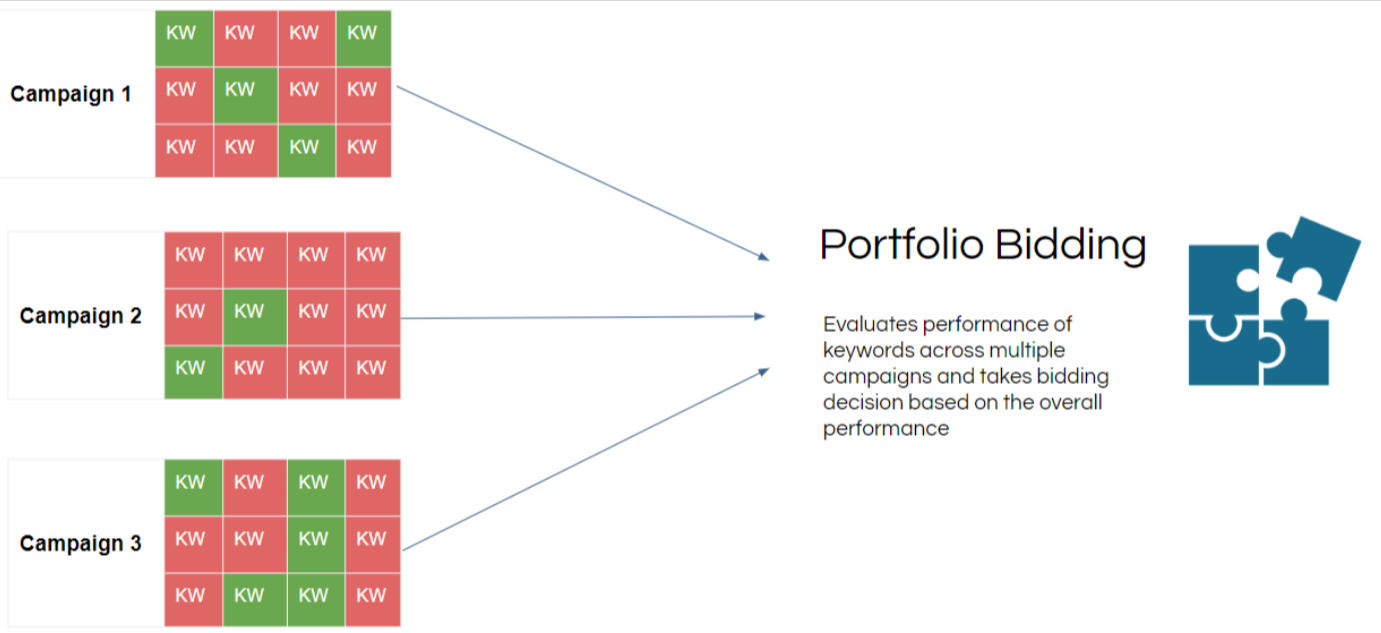
3. Automated Portfolio Bidding Solution: We employ a portfolio bidding strategy to adjust bids based on campaign objectives. However, if a keyword lacks sufficient data for individual bidding, we leverage portfolio-level data to guide our bid decisions.
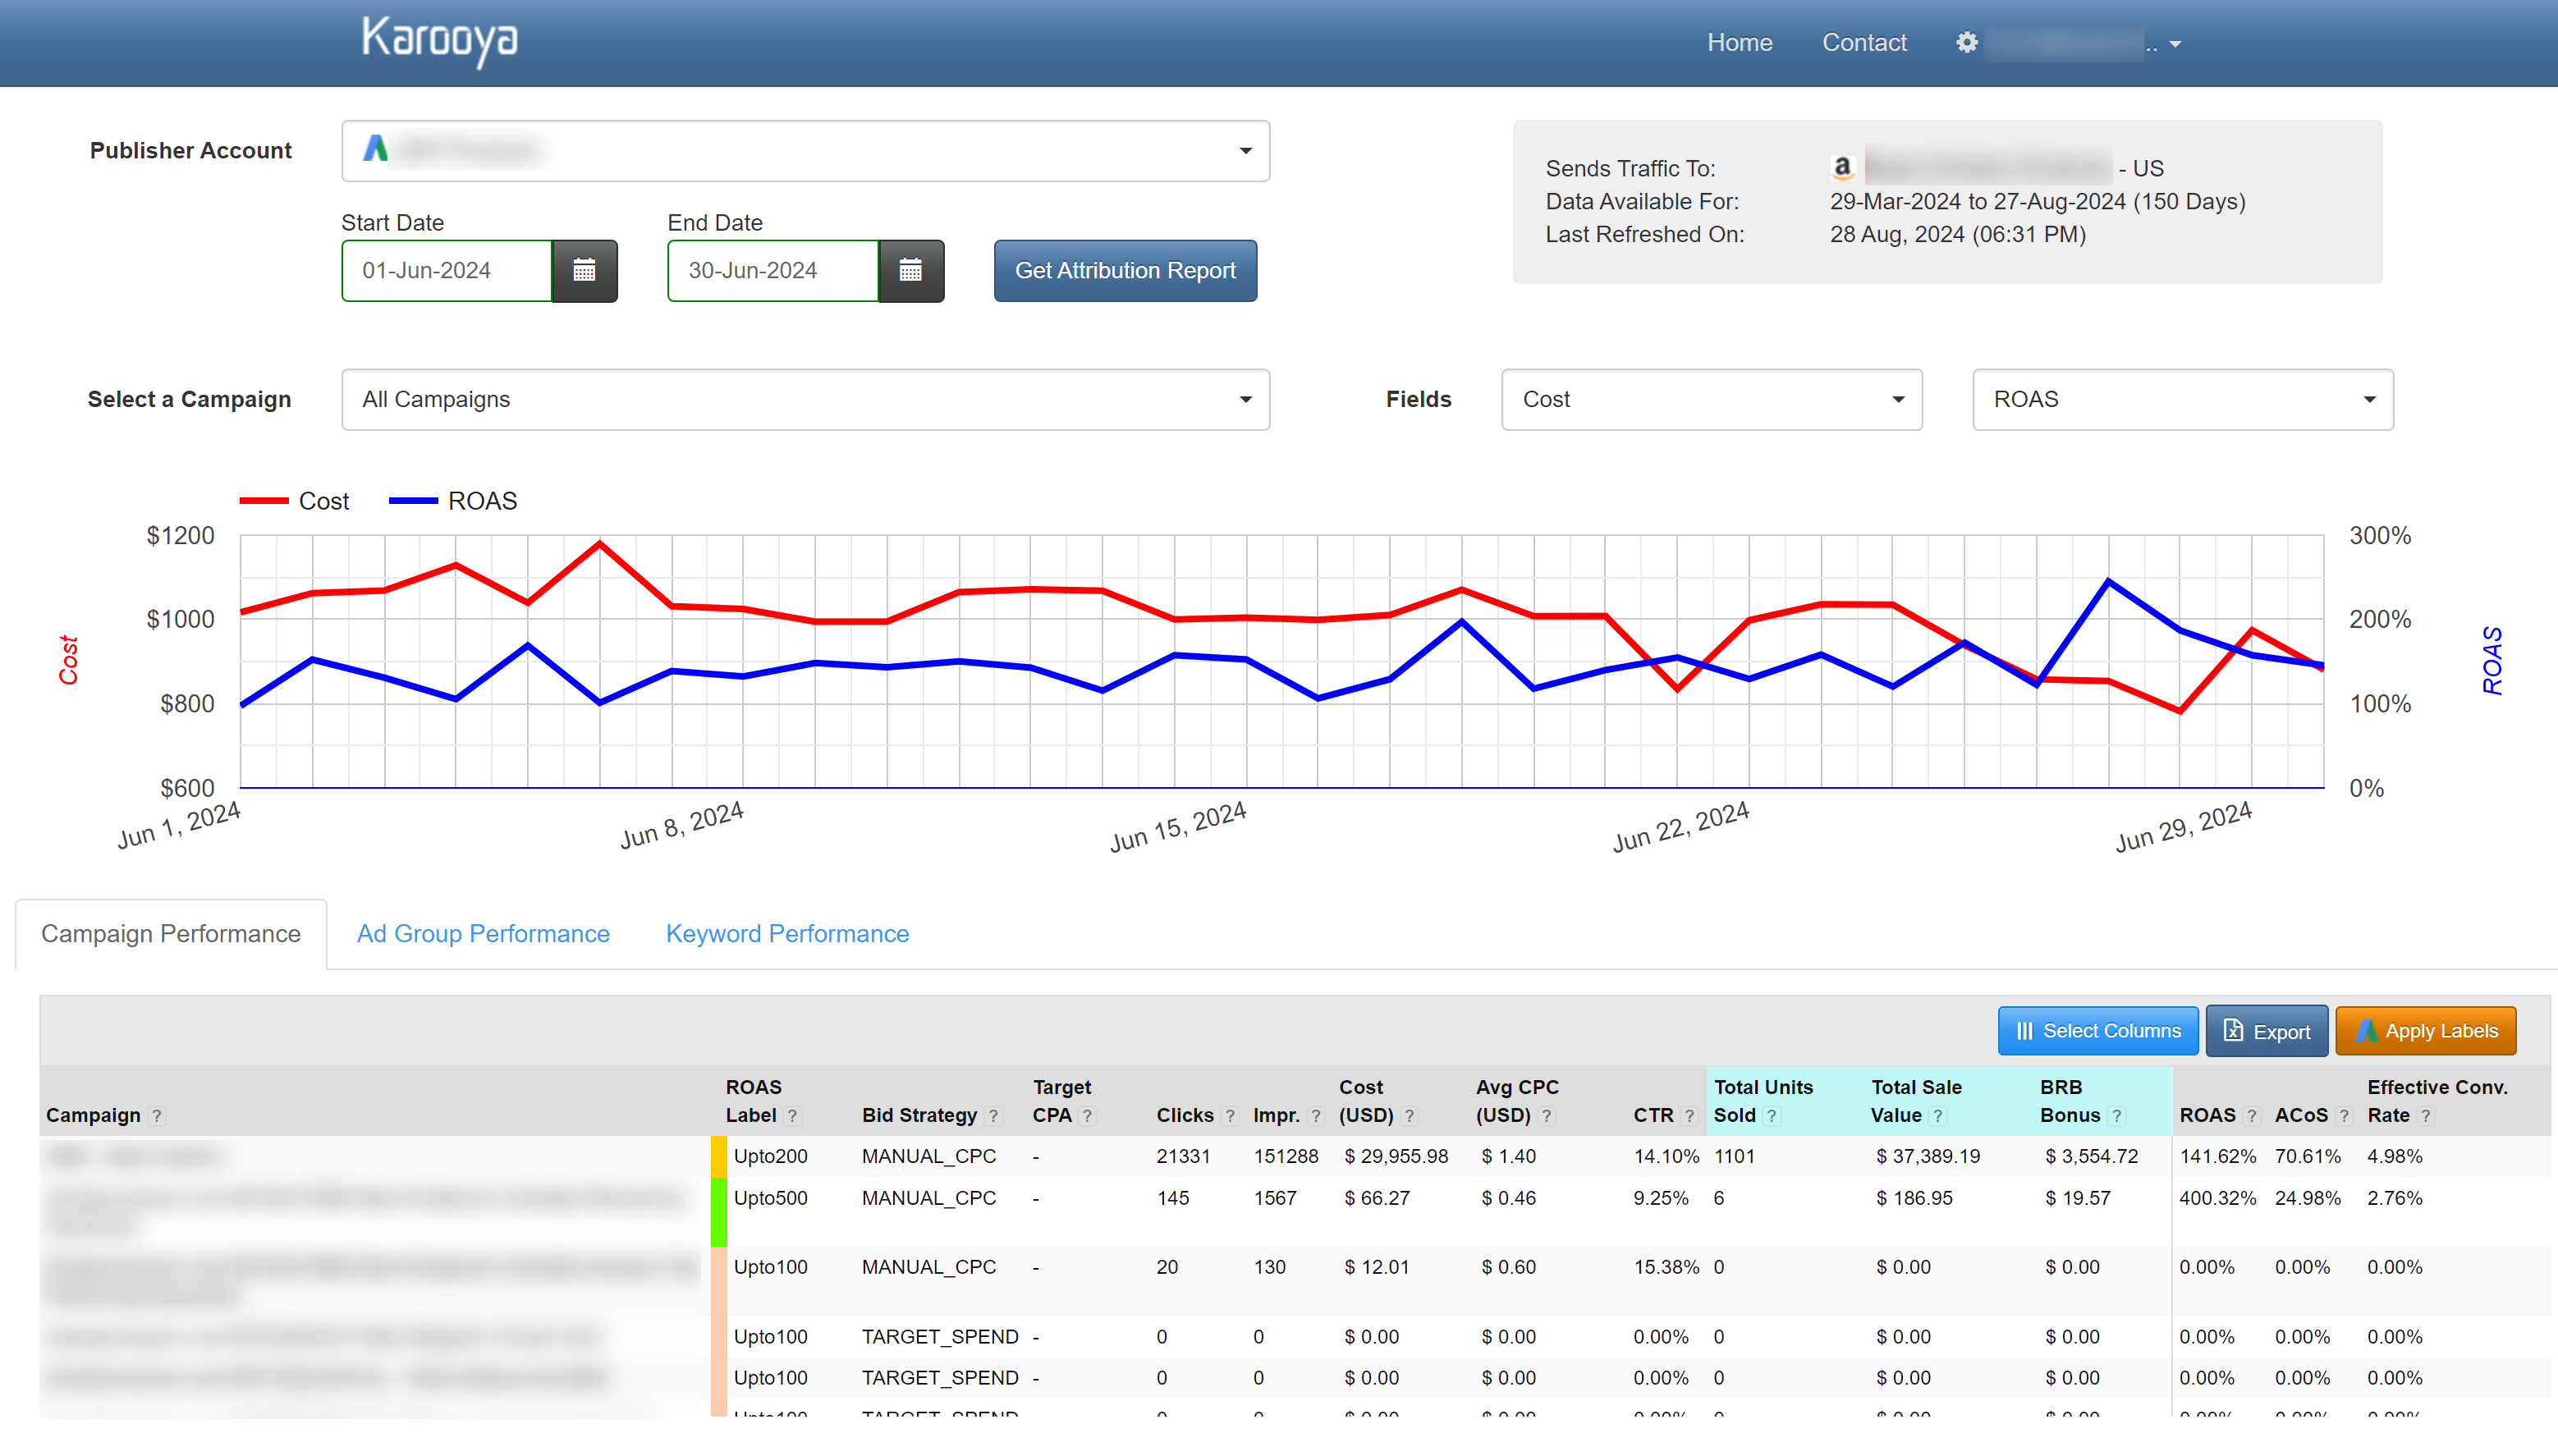
Google Ads Performance Charts for Amazon Products
Karooya recently implemented a new feature that lets users plot daily performance charts for their Google Ads account that promotes Amazon products.
When users access the Amazon Attribution reporting dashboard and request a performance report for a specific date range, a trend chart appears above the report table. This chart visually represents key performance metrics over time thus, helping users quickly identify patterns in their advertising data.
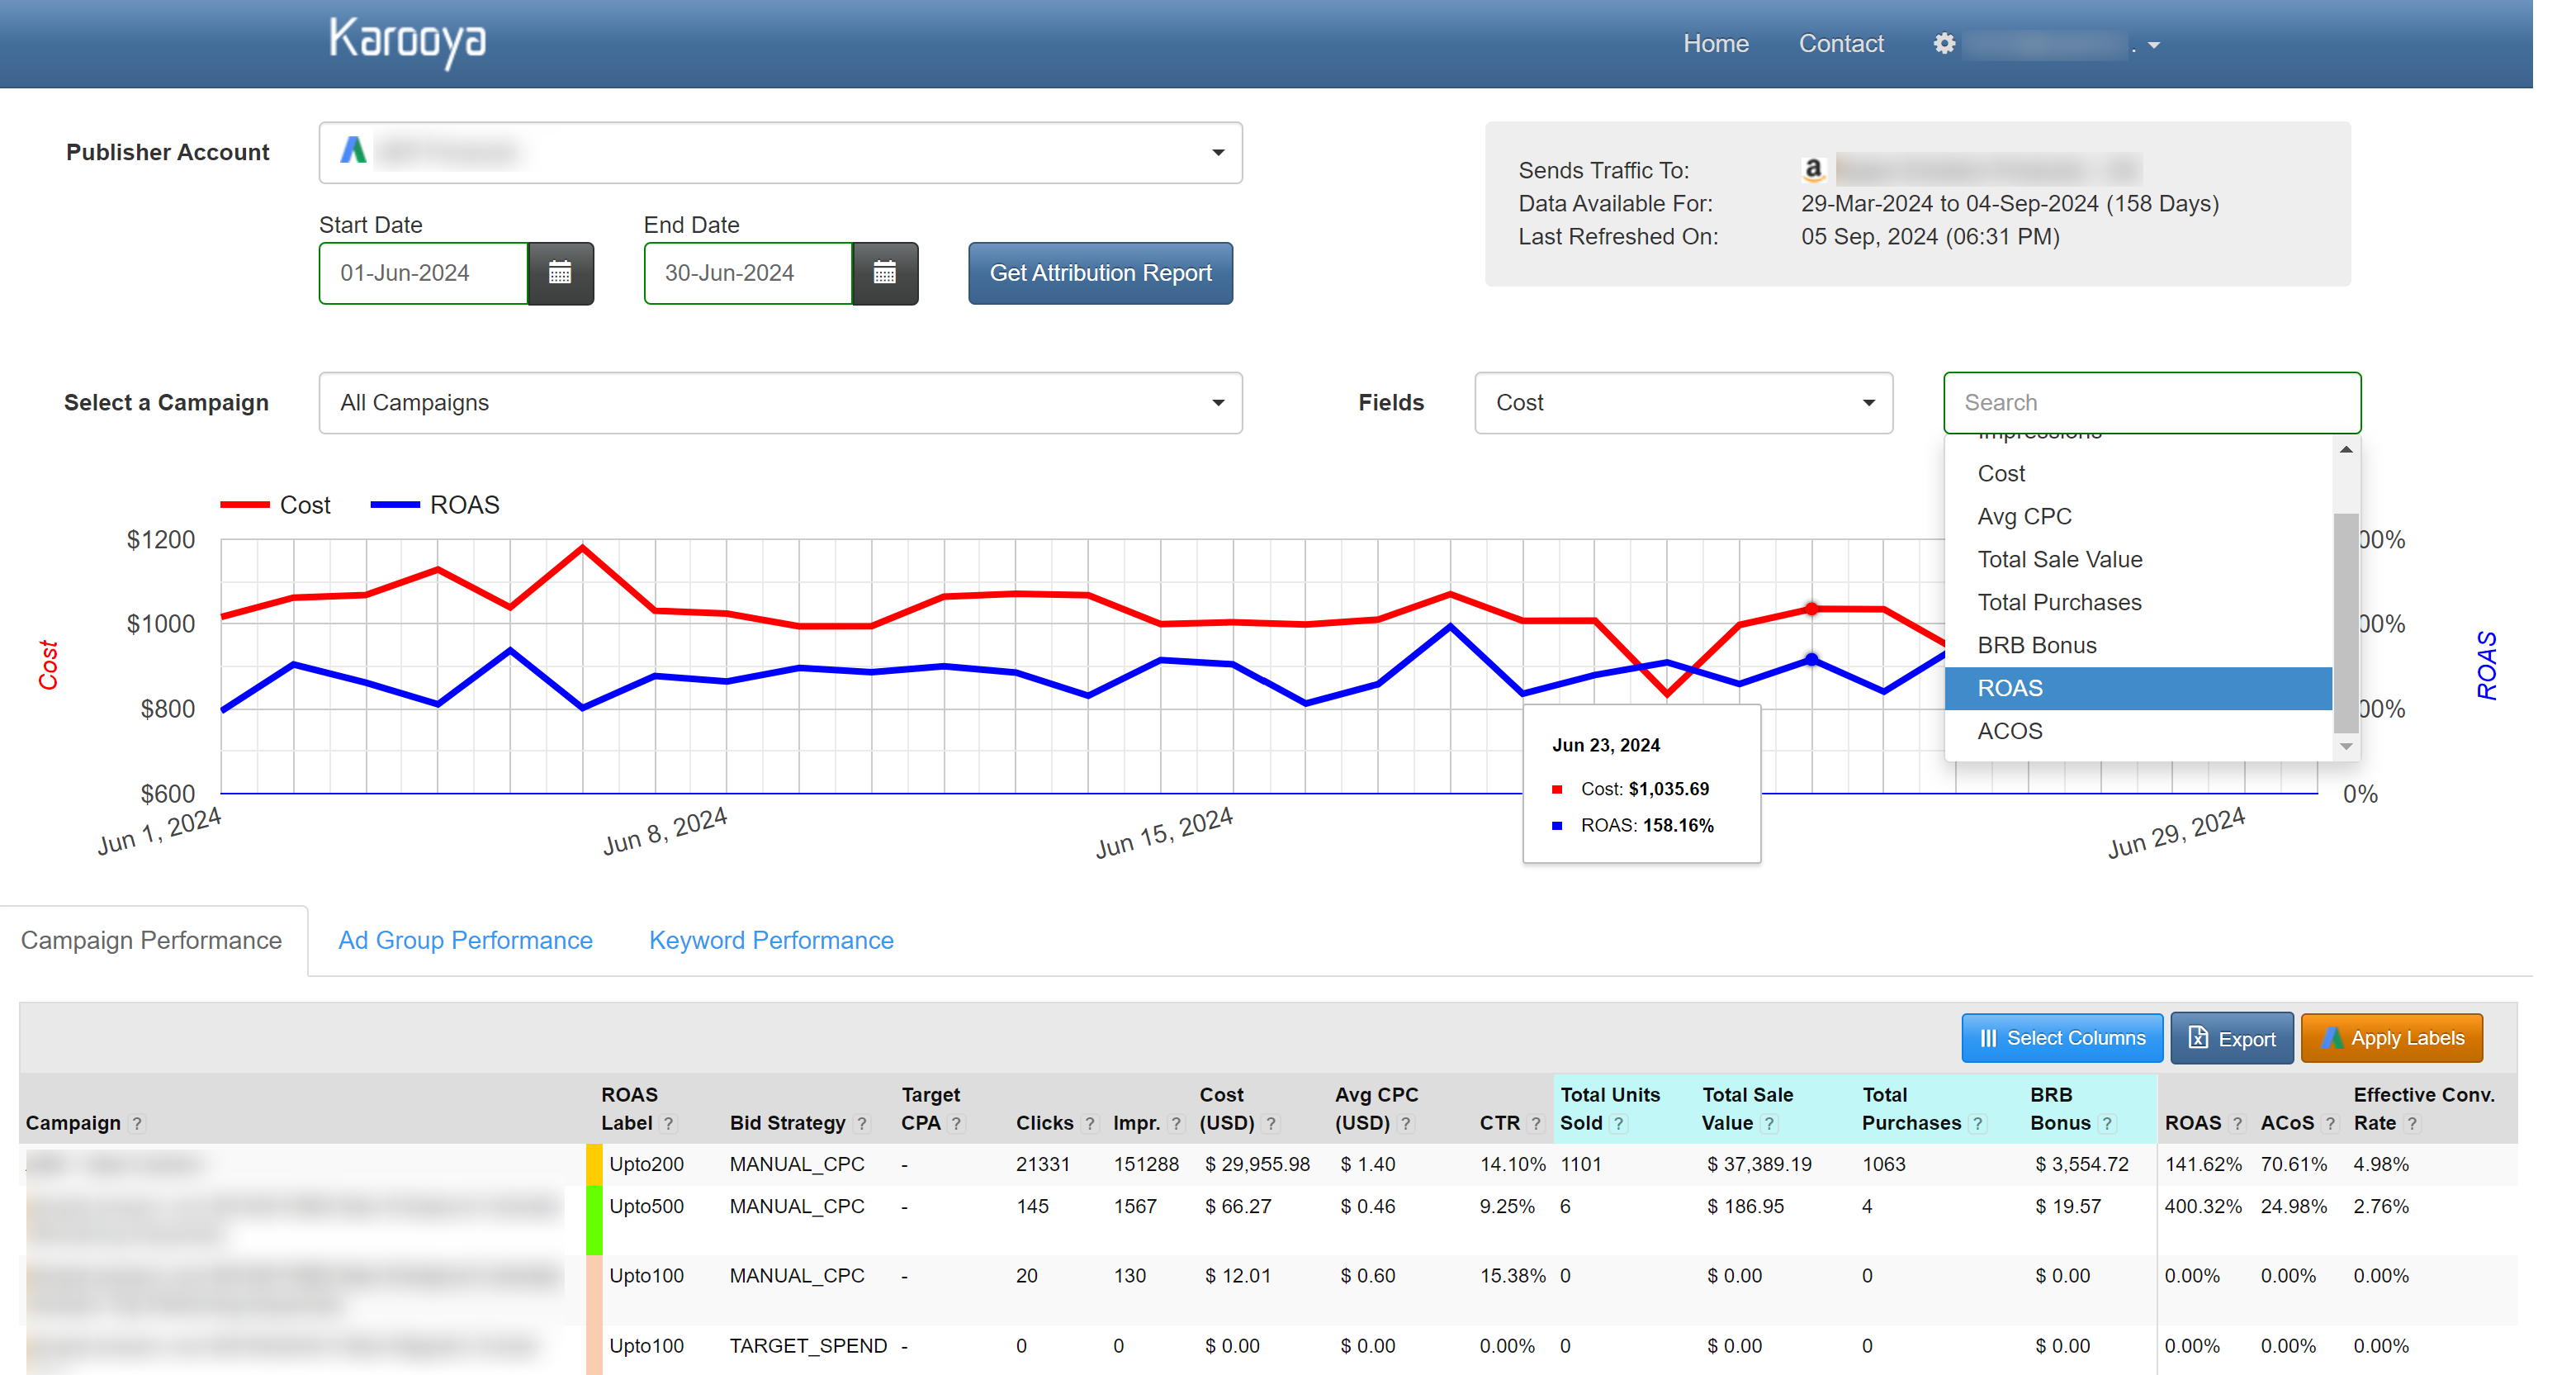
Additionally, users can customize the chart by selecting various fields. This will enable them to focus on the metrics most relevant to their goals for deeper insights into campaign performance.
Users can also choose to plot the chart for account-level data (all campaigns together) or select an individual campaign to plot the performance metrics.
Below are the available performance metrics for the chart:
- Clicks
- Impressions
- Cost
- Avg CPC
- Total Sale Value
- Total Purchases
- BRB Bonus
- ROAS
- ACOS
What’s the Next Step?
Sign up using your Google Ads or Amazon Ads account to get started. Then, go to settings and link your other account. For instance, If you signed up with your Google Ads account, link your Amazon Ads account here. It works the other way around too.. Please email us at support@karooya.com, and we will guide you through the setup process.
Related Links


Stop the wasted ad spend. Get more conversions from the same ad budget.
Our customers save over $16 Million per year on Google and Amazon Ads.