Tinuiti, a US-based digital marketing agency, shared its Digital Ads Benchmark Report for Q4, 2022. This report is based on anonymized performance data from advertising programs under Tinuiti management. It gives us insight into quarterly trends across Google, Meta, Amazon and more. Some of the study’s key findings are documented below.
The complete report can be downloaded here.
Spending Growth Declined Across Major Digital Ad Platforms
In Q4 2022, most of the major platforms in the US saw a decline in digital ad spending growth.
Despite the early 2021 statistics being terrible due to the pandemic, year-over-year spending growth rates for digital ads surged. Although year-ago expenditure growth comparisons are currently declining, advertisers are facing the new economic challenges of high inflation, rising interest rates, and the uncertainty of whether the US economy is in for a soft landing or a harsh recession.
The only larger format to expand faster than Google search ads in Q4 2022 was Amazon Sponsored Product ads which had experienced the slowest expenditure growth slowdown since early 2021. Google search ads delivered reasonably significant growth of 10% Y/Y in Q4 2022.
Meta is also pursuing innovation, and marketers are experiencing early success with novel offerings like Advantage+ Shopping ads. n Q4 2021, Tinuiti advertisers increased their Meta ad spending by 32% year over year, which is a significant increase from the official numbers from Meta for that quarter.
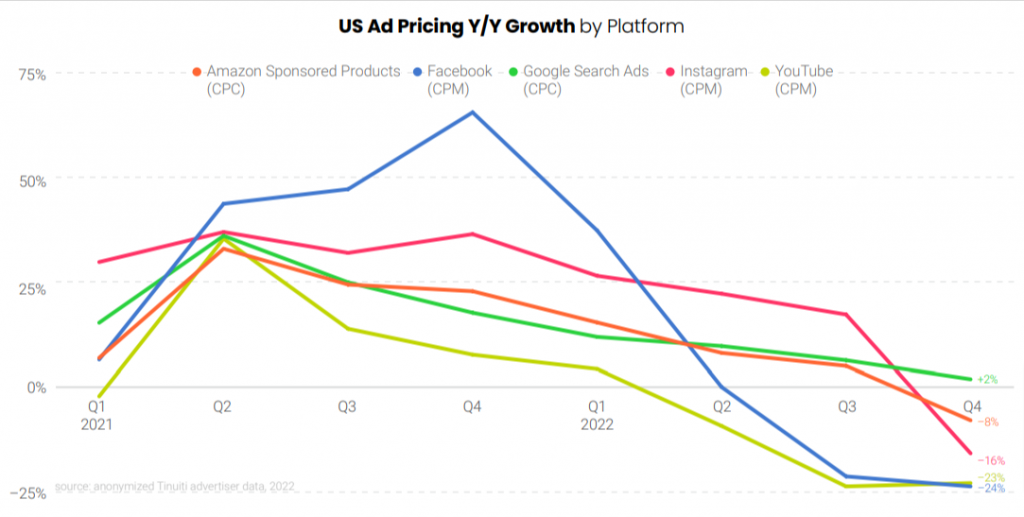
As things began to settle down in early 2021, digital ad prices rose dramatically year over year. In Q2 2021, marketers paid an average price increase of 37% Y/Y across Google, Amazon, Facebook, Instagram, and YouTube.
Holiday Shopping Season in 2022: A Review
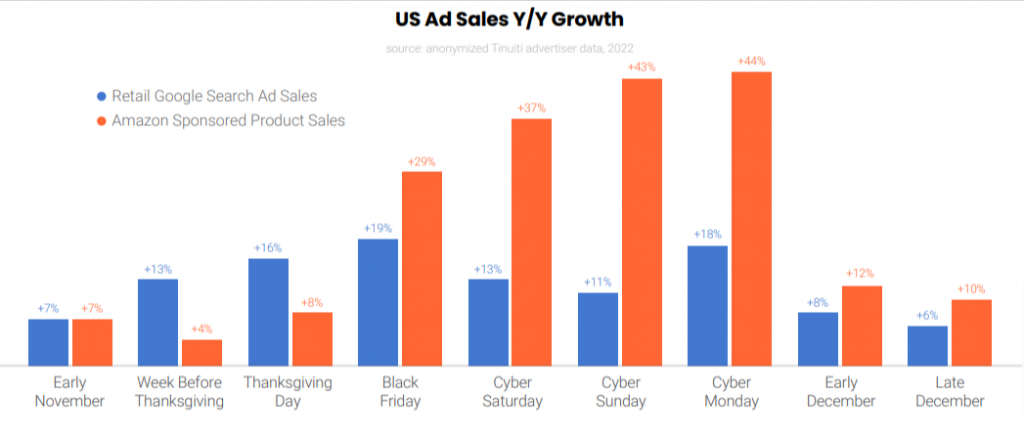
Although news of economic worries including inflation and the potential for a recession was at the forefront, the Tinuiti Holiday Shopper Study found that many customers still anticipated spending as much as or even more on gifts during the holiday shopping season in Q4. Sales that are linked to Amazon and Google ads increased for many US consumers.
Amazon sales per click significantly outperformed Google search ads throughout the holiday shopping season, especially when compared to early November.
Paid Social Platforms Experienced A Rollercoaster Q4
In Q4 2021, meta advertisers had a staggering 56% increase in the cost of ad impressions, however, CPM growth has eased ever since, declining by 22% year over year in Q4 2022. Growth in impressions from Meta’s flagship app rose 23% Y/Y in Q4.
In Q4 2022, CPM was 26% higher on Facebook than in Q4 2020 and 15% higher on Instagram than two years prior. Android smartphone and iPhone meta ads CPM were the same in Q4.
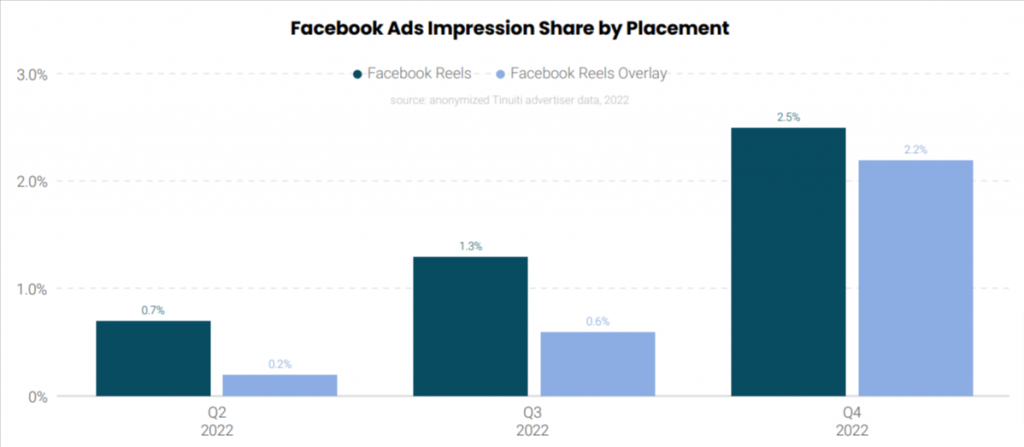
Reel impressions in Facebook ads and Instagram growing quickly. Reels ads accounted for just 1.1% of Instagram ad impressions back in Q4 2021, but that rose all the way to 8.3% in Q4 2022. Reels video ads rose from 0.7% of Facebook ad impressions in Q2 2022 to 2.5% in Q4. Reels Overlay ads grew from just 0.2% of Facebook ad impressions to 2.2% over the same time frame.
The average Tinuiti advertiser who has been using TikTok since at least Q4 2021 increased their ad spending by 81% year over year in Q4 2022, and the platform’s CPM increased by 12%. The median Tinuiti advertiser’s CPM for TikTok Ads was 61% higher in December than it was in July 2022 as the competition increased for the Q4 holiday shopping season.
Google Search CPCs For Text Ads & Retailers Had Ups And Down
Average CPCs for Google Text and Shopping ads were up by as much as 36% Y/Y in 2021 however, In Q4 2022, average search ad CPC was up just 2% Y/Y. With Google search ad clicks up 8% in Q4, search spending increased 10% Y/Y, down from 15% growth a quarter earlier.
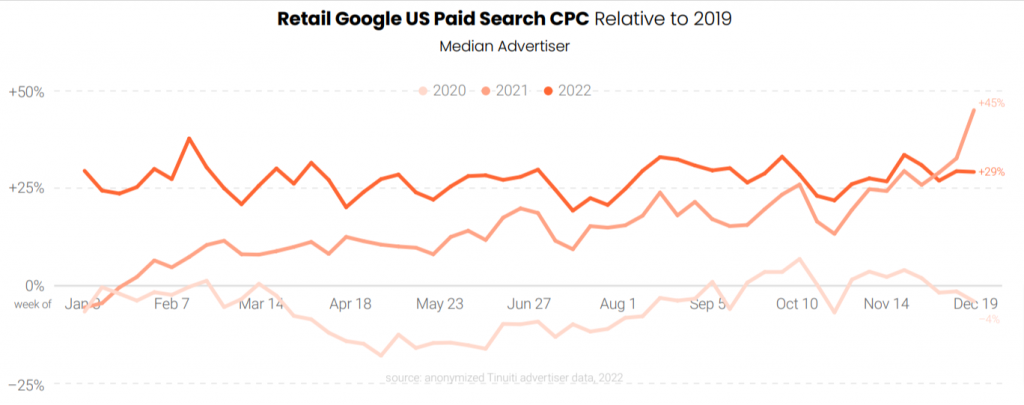
Compared to 2019, Google search CPCs were up by 28% for retailers over Q4 2022. Early on in the pandemic, retail CPCs decreased by roughly 20% year over year before beginning to rebound in the second half of 2020. CPCs spiked throughout 2021 before stabilising in early 2022 relative to 2019 levels.
While Shopping CPC growth continued to decelerate in Q4, text CPC growth remained at 7% Y/Y with some advertisers reporting that CPCs for their brand names are back on the rise. Shopping ad click growth improved from 11% Y/Y in Q3 2022 to 16% Y/Y in Q4, but average CPC fell 3% in Q4, down from a 7% increase in Q3.
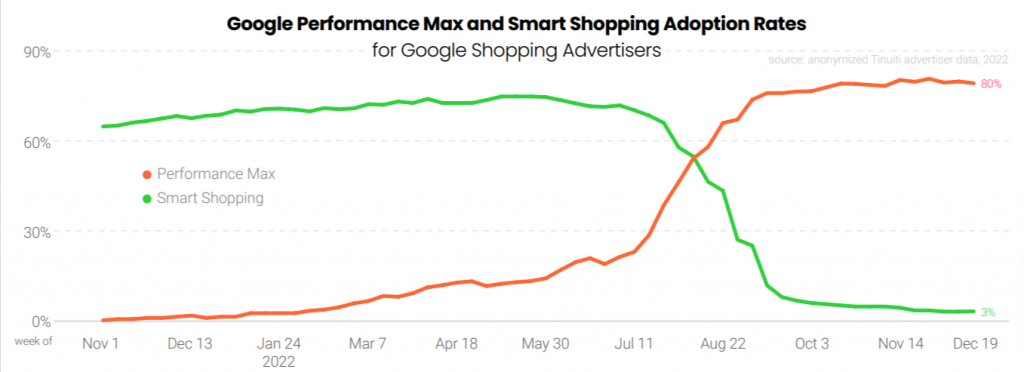
The adoption of PMax campaigns is higher in comparison to Smart Shopping. In Q4, fully 80% of Google Shopping advertisers employed PMax campaigns to some extent.
In Q4 2022 PMax CPCs were 3% lower than standard Shopping CPCs however, it did generate 31% higher click-through rates but that is not on a like-for-like inventory basis.
CPCs Continue To Fall Off For Sponsored Brand, Products And Display
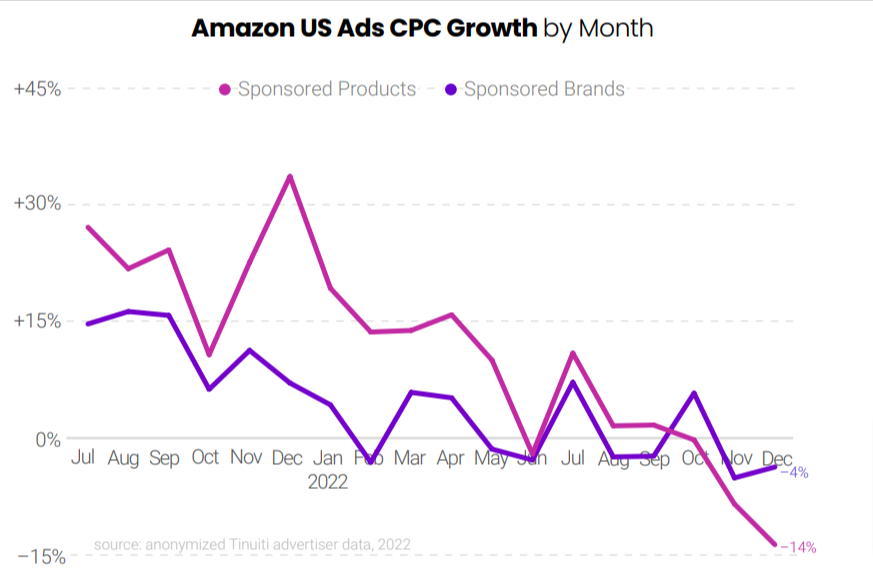
In Q4, the average CPC for Amazon Sponsored Products ads fell 8% year over year, the first fall since 2020 and the sixth consecutive quarter of deceleration.
The average CPC of Amazon Sponsored Display ads declined 12% year over year in the final quarter of 2022. Most product categories in Amazon Sponsored Product ads experienced decline in CPC.
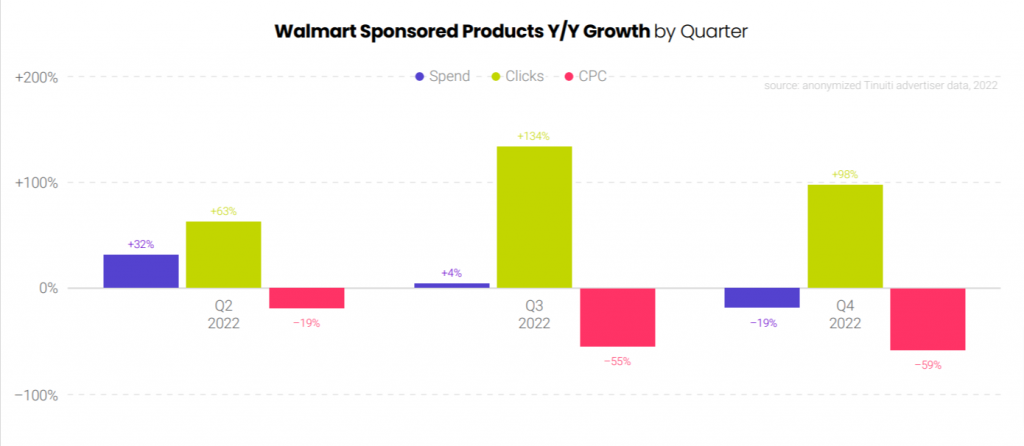
Average CPC for Walmart Sponsored Product has also plunged. In Q4 2022, Walmart Sponsored Products clicks were up a whopping 98% Y/Y, while the average CPC dropped 59%.
11% of all Walmart search ad investment in Q4 2022 went to Sponsored Brands, up from just 7% in Q4 2021. 67% of Walmart search ad clicks came from mobile App which was up from just 49% in Q4 2021. Desktop accounted for only 11% of clicks, it drove 17% of all sales attributed to search ads.
Significant Decline in CPMs Across Display And Video
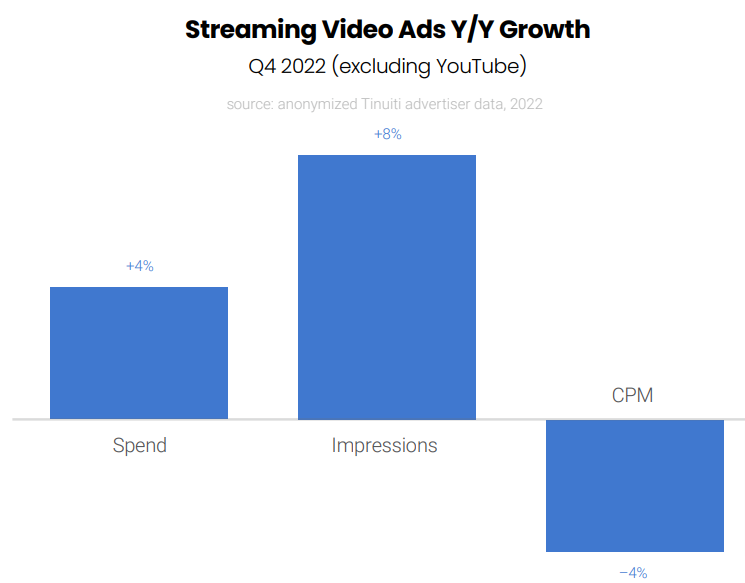
The average CPM for YouTube marketers dropped by 23% Y/Y, despite significant impression growth of 33% for the platform. In Q4 2022, spending on streaming video ads, excluding YouTube, increased 4% Y/Y but impressions decreased 4% and CPMs decreased 4%.
Discovery ad impressions increased by 21% year over year while CPMs declined by 19% in Q4 2022. As a result, same-site spending on Discovery ads decreased by 1% Y/Y in Q4 2022.
Average CPM for the Google Display Network was up 3% and for placements made through Google DV360, average CPM fell 15% Y/Y. While phones continued to account for a majority of DV360 spend, phone spend share fell from 63% in Q4 2021 to 59% in Q4 2022. CTV spend share increased from 9% in Q4 2021 to 17% in Q4 2022.
To get the complete Digital Ads Benchmark Report, download the report here.
Related Links




Stop the wasted ad spend. Get more conversions from the same ad budget.
Our customers save over $16 Million per year on Google and Amazon Ads.